
Figure 4.
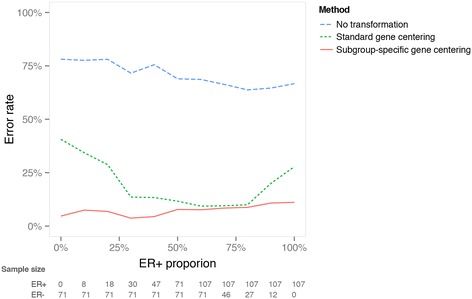
Comparison of various data transformation strategies for predicting molecular subtypes on study cohorts with varying estrogen receptor proportions. Datasets were constructed with percentages of estrogen receptor (ER)-positive cases ranging from of 0% to 100%. The ER-positive and ER-negative samples randomly drawn from the University of North Carolina set. Error rate is plotted against the composition with respect to ER for no, standard and subgroup-specific gene-centering strategies.