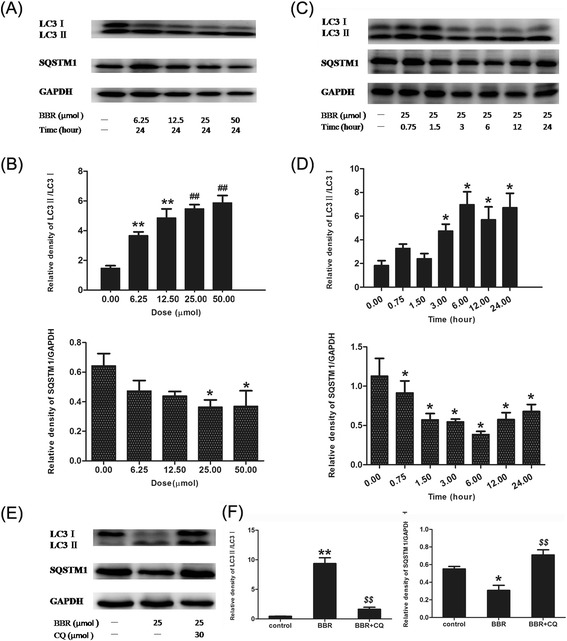
Figure 3.

Berberine induced autophagy in J774A.1 cells. (A) Representative blots of LC3 and SQSTM1/p62 in J774A.1 cells treated with a series of concentrations of berberine (6.25, 12.5, 25 and 50 μM). (B) Bar graphs showed the quantification of endogenous LC3 and SQSTM1. Experiments were repeated at least three times. (C) Representative blots of LC3 and SQSTM1/p62 in J774A.1 cells treated with 25 μM berberine for different time intervals (0.75, 1.5, 3, 6, 12 and 24 h). (D) Bar graphs showed the quantification of endogenous LC3 and SQSTM1. Experiments were repeated at least three times. (E) Representative blots of oLC3 and SQSTM1/p62 in J774A.1 cells treated with 25 μM berberine in the presence or absence of 30 μM CQ. (F) Bar graphs showed the quantification of endogenous LC3 and SQSTM1/p62. Data are expressed at the mean ± SEM in the corresponding area. **P < 0.01 V.S. control group, *P < 0.05 V.S. control group; ##P < 0.01 V.S. 6.25 μM and 12.5 μM groups; $$P < 0.01 V.S. BBR group.
