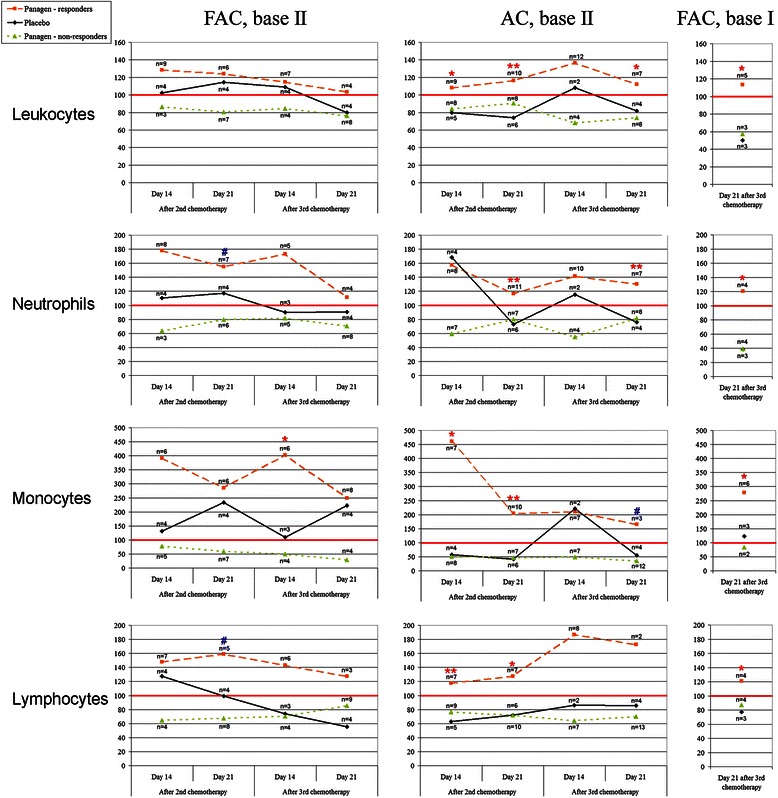
Figure 3.

Changes in stimulation indices (%) for blood cell types throughout three chemotherapy courses. Median values per group are shown. The number of patients per group is indicated for each time point. Stimulation index is expressed as a ratio of values measured in second and third control time points (days 14 and 21) to the appropriate value observed in the control point of the first chemotherapy course (set as 100%). Patients were subgrouped into Panagen-responders, Placebo and Panagen-non-responders. Red line denotes 100% level, i.e. the values reported in control time points (days 14 and 21) after the first chemotherapy. Values that show statistically significant difference between Panagen-responders and Placebo patient groups (Wilcoxon-Mann–Whitney test) with р < 0.01 (**), р < 0.05 (*) and р < 0.09 (#) are highlighted.
