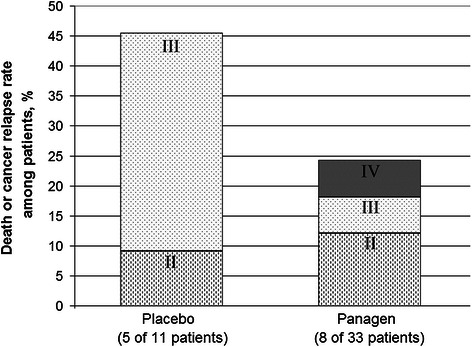
Figure 8.

3-year follow-up analysis of Panagen clinical trial. Percentage of relapse events and deaths of patients relatively to the total number of patients. Data for patients from the base II (FAC and AC regimen) are presented. Each group of bars is labeled to show the percentage of patients having stage II, III or IV cancers.
