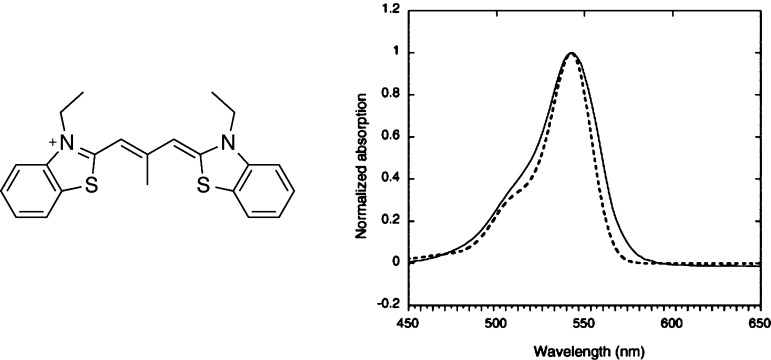
Figure 1.
Comparison between TD-DFT (dotted lines) and experimental (full lines) band shapes for a typical cyanine dye. Note that an offset of 0.5 eV has been applied on the theoretical curve so that the TD-DFT 0–0 energy matches its experimental counterpart. Adapted with permission from ref (29). Copyright 2006 Elsevier.

