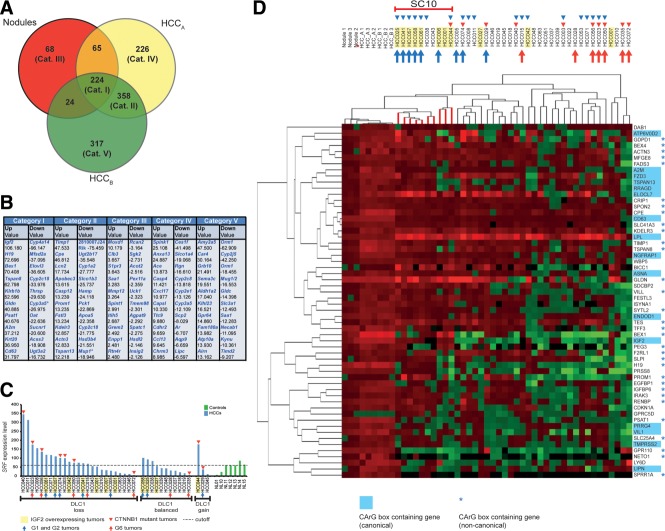
Figure 6.
SRF-VP16-triggered mHCCs share expression profiles with G1/G2 subgroups of hHCCs. (A) Venn diagram depicting differentially expressed transcripts in all three types of tissue (Category I), mHCCs (Category II), nodular tissue (Category III), mHCCs without Ctnnb1 mutation (HCCA; Category IV), and mHCCs with Ctnnb1 mutation (HCCB; Category V). (B) Listing of 10 most strongly up- or down-regulated transcripts per category (x-fold differential expression). (C) Cohort of 40 hHCCs grouped according to genomic DLC1 status (X-axis) and SRF mRNA expression levels (Y-axis). IGF2 RNA overexpression status (yellow box), CTNNB1 mutation status (red triangle), Boyault class (G1 and G2, blue arrow; G6, red arrow). (D) Combined unsupervised hierarchical clustering of the 58 most strongly up-regulated transcripts in SRF-VP16-triggered nodular/mHCC tissue against 40-membered hHCC cohort (blue triangles: SRF overexpressing tumors, other symbols as in (C)). The "subcluster of 10" hHCCs (SC10) cluster close to the mHCCs. Murine genes contain a canonical (blue box) or noncanonical CArG-box (blue asterisks).

