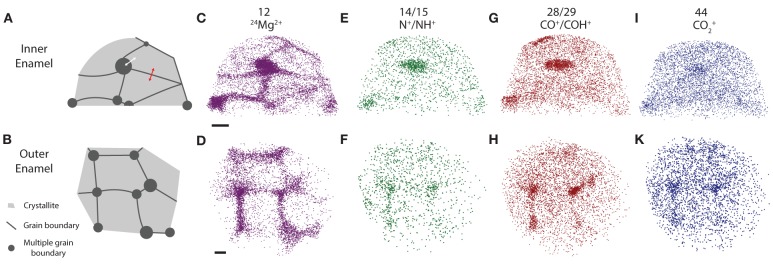
Figure 4.

APT reconstructions. (A,B) Schematic drawing of grain boundaries between mouse enamel crystallites, (C,D) 24Mg2+, (E,F) N+, (G,H) CO+, (I,K) CO+2 ion positions in mouse inner and outer enamel. Scale bars correspond to 10 nm. Composition profiles (Figure 5) are determined by averaging concentrations in the direction normal to a grain boundary, as indicated by the red arrow. Proximity histograms (Figure 5) report average concentrations relative to an isosurface, approximately indicated by white arrow, but integrated over the entire surface. Reconstructions are oriented such that the view direction is parallel to the long axis of the nanowires, i.e., along the [00.1] zone axis.
