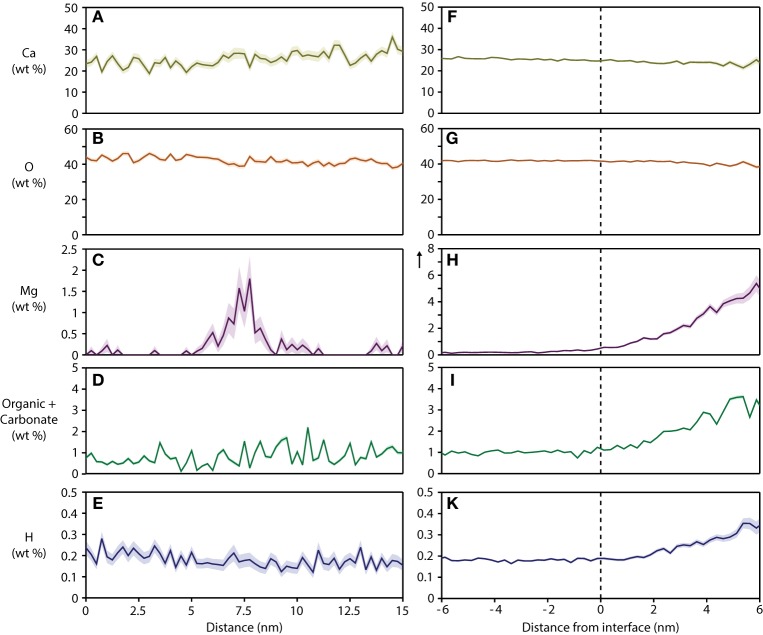
Figure 5.
Concentration profiles and proximity histograms. Representative concentration profiles across grain boundaries (A–E) and proximity histograms of an organic-rich intergranular region (F–K) in mouse inner enamel. Note that in proxigrams, distance is plotted relative to the position of the isosurface (0.5 at% Mg), i.e. the interface between the OHAp nanowire and the precipitate. The vertical arrow in plot (H) indicates an extended y-axis compared to the corresponding plot (C).

