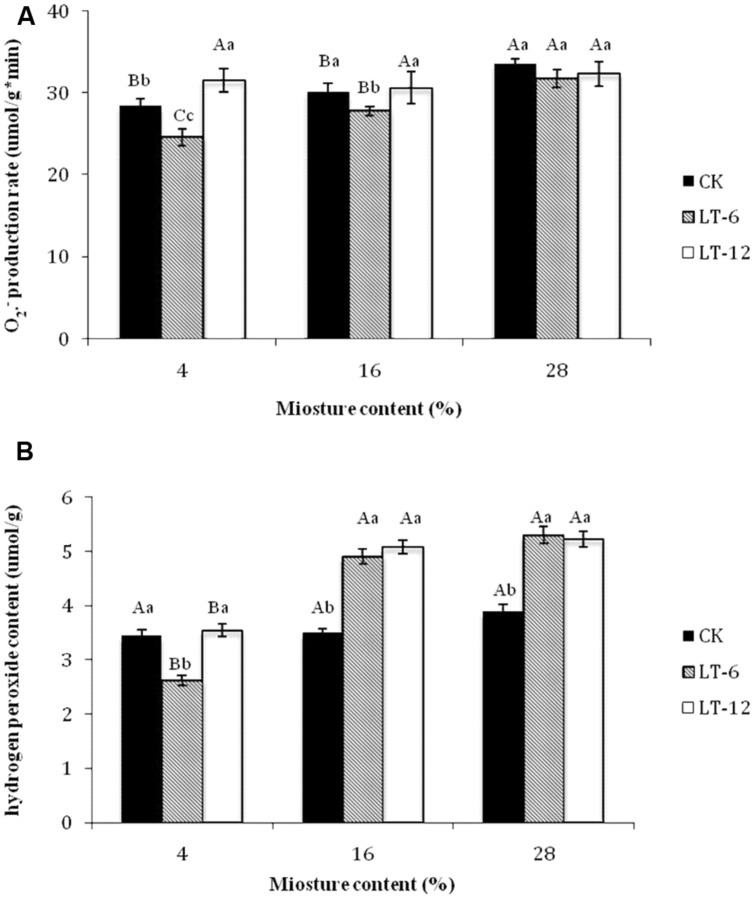
FIGURE 2.
Effect of storage duration on production rate and H2O2 content of oat seed with different MC at 4°C. (A) production rate; (B) H2O2 content. The different letters indicate significant differences at 0.05 level among treatments as determined by the Duncan’s multiple range test. Means with different capital letters indicate the significant differences of seed at different MC and same storage duration, and with different lowercase letters at the same MC and different storage duration. Data represent the mean ± SD of four or more replicates.

