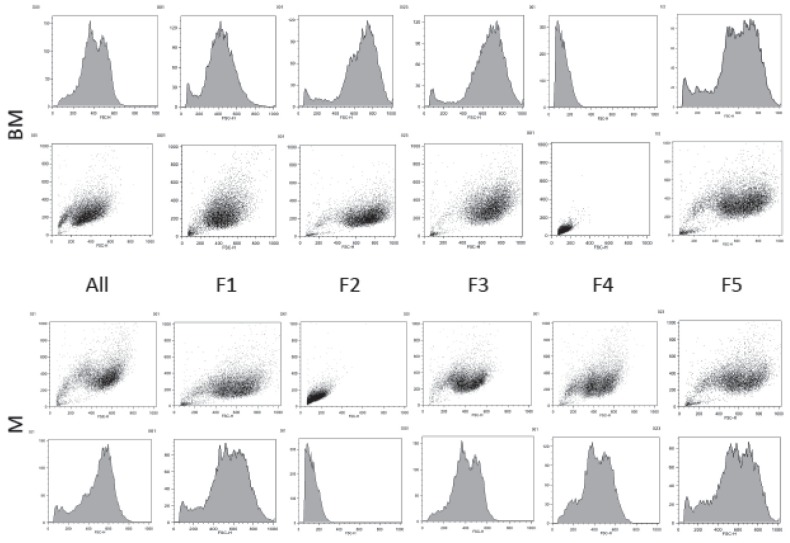
Figure 3.
Results of flow cytometric analysis of mesenchymal stem cells (MSCs) cultured from 5 sorted fractions (F1 to 5) and 1 unsorted control (UC) derived from equine muscle (M), bone marrow (BM), and unstained for assessing the population granularity (x-axis) and size (y-axis). Dot plot and corresponding histogram graphical representation of the subpopulations depict a distinctly different population in bone marrow fraction 4 and muscle fraction 2. The fluorescence intensity (arbitrary units) is depicted.

