
Figure 2.
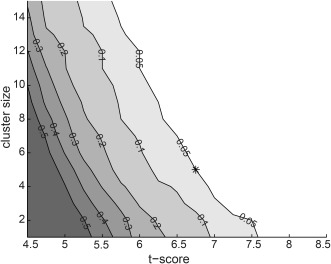
Estimation of appropriate statistical threshold. From 200 sets of simulated data (see Methods for a description) we obtained a distribution of findings at each threshold pair (t‐score and cluster size). Each contour line depicts the likelihood level that a random data‐set would yield a chance finding. The selected parameter set (t‐score = 6.75, cluster size = 5), with a probability of chance findings of 0.05 or less, is indicated by a star.