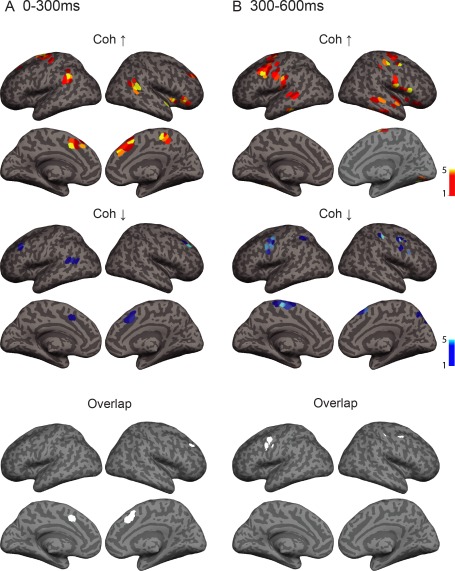
Figure 3.

Spatial structure of overall network modulations between overt and silent naming across all frequency bands at (A) 0–300 ms and (B) 300–600 ms after image onset. Enhanced coherence between cortical regions is shown in yellow‐red colorscale (top) and reduced coherence is shown in blue (middle). Images are colorcoded according to connection density (number of significant connections connecting to a specific grid point). Overlap between grid points showing increased vs. decreased coherence in the early (left) and late (right) time window is shown in white (bottom). Results are shown at a significance level of P = 0.05 (corrected). Coh ↑ = task‐related increase in coherence, Coh ↓ = task‐related decrease in coherence.
