
Figure 4.
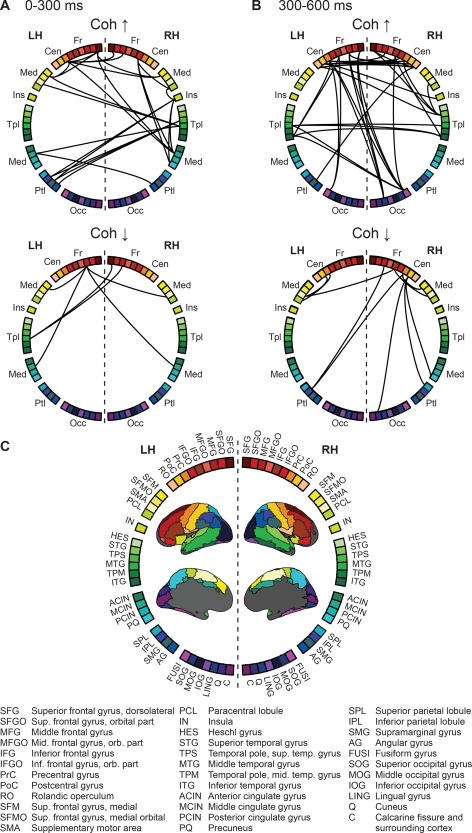
Task‐dependent modulation of interareal coupling at (A) 0–300 ms and (B) 300–600 ms after image onset. The adjacency matrix is visualized using a (C) circular plotting scheme with nodes based on the AAL parcellation scheme. Coh ↑ = increased coherence, Coh ↓ = decreased coherence, Fr = frontal regions, Cen = central, Med = medial, Ins = insula, Tpl = temporal, Ptl = parietal, Occ = occipital, LH = left hemisphere, RH = right hemisphere. Results are shown at a significance level of P = 0.05 (corrected).