
Figure 2.
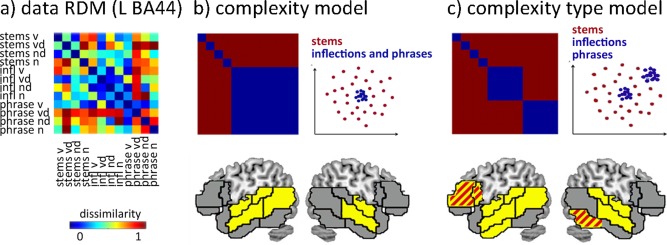
a) Activation RDM from L BA44: 12 × 12 matrix of correlation distances (one minus the correlation value) between activation patterns for each pair of conditions. RDMs are symmetrical across the diagonal. b) Upper left: model RDM coding for sensitivity to complexity processing, regardless of type. Blue indicates correlated activation patterns due to a shared property (presence of complexity), red indicates no correlation. Upper right: cartoon representation of the hypothesized distribution of the activations patterns in any given region. Each dot represents one activation pattern; the dissimilarity between them is shown as distance in 2D Euclidean space. Bottom: Brain regions that significantly correlate with this model (P < 0.05). c) A model RDM which codes for differential sensitivity to inflectional and phrasal complexity. Regions that significantly correlate with this model (P < 0.05) are shown in yellow. Red stripes indicate regions where this model fits significantly better than the general complexity model.