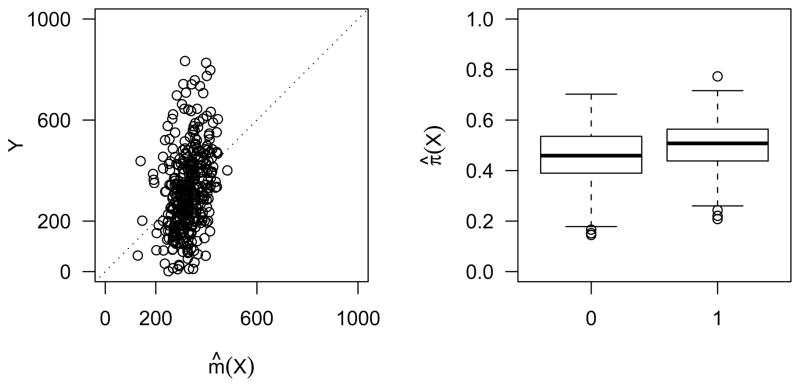
Fig. 1.
Parametric fit to the response and the missingness. On the left is the observed response versus the fitted response from linear regression. On the right is the box plot of the fitted propensity score from linear logistic regression: 0 for the subjects with Y missing and 1 for the subjects with Y observed.

