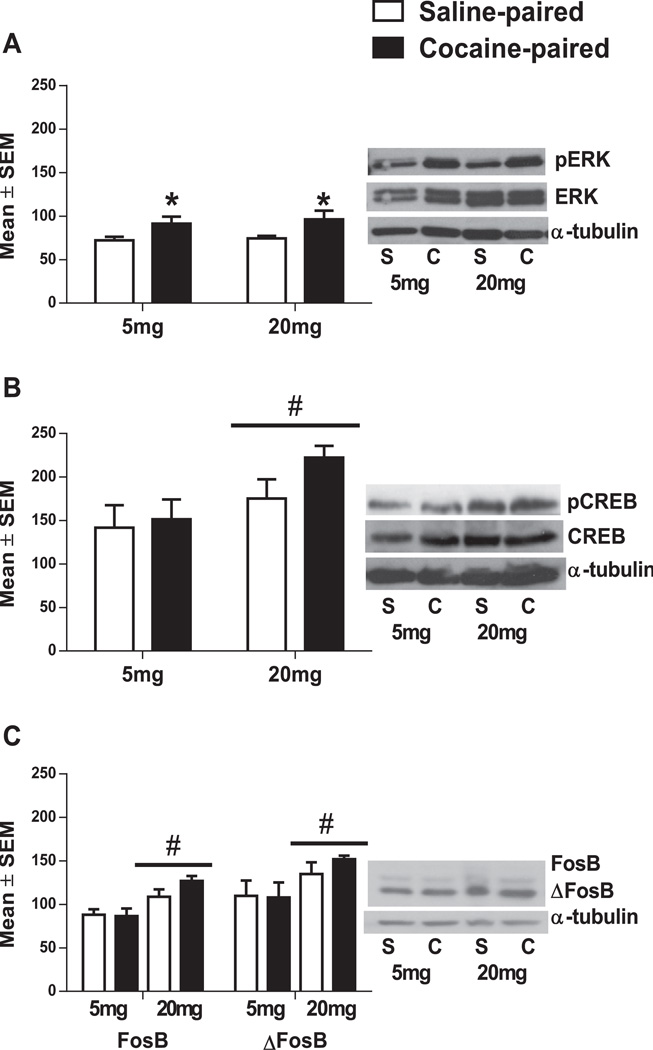
Fig. 3.
NAc (A) pERK1/2, (B) pCREB and (C) FosB/ΔFosB protein levels after re-exposure to the cocaine paired or saline paired chamber after conditioning with 5 mg/kg (left) or 20 mg/kg (right) cocaine (24 h after initial CPP test). Phosphorylated protein levels are expressed as a ratio to total protein levels (normalized to α tubulin). *Significant difference from rats re-exposed to the saline-paired chamber of the same dose at the p < 0.05 levels. #Significant difference between rats trained with 5 and 20 mg/kg cocaine (n = 4– 5 animals per group).

