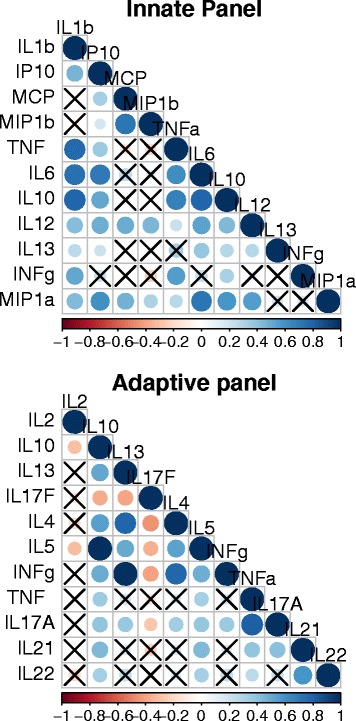
Figure 2.

Correlation matrix of the cytokines of the innate (upper) and the adaptive (lower) panels. The pair wise correlation between the different cytokines measured is depicted. The intensity of the colours as well as the diameter of the circles give an indication of the degree of correlation between two cytokines and reflect the strength of spearman’s rho correlation coefficient. The crosses represent correlation coefficients that were not statistically significant. Significance was tested using a spearman rank test and level of significance was set at p < 0.05.
