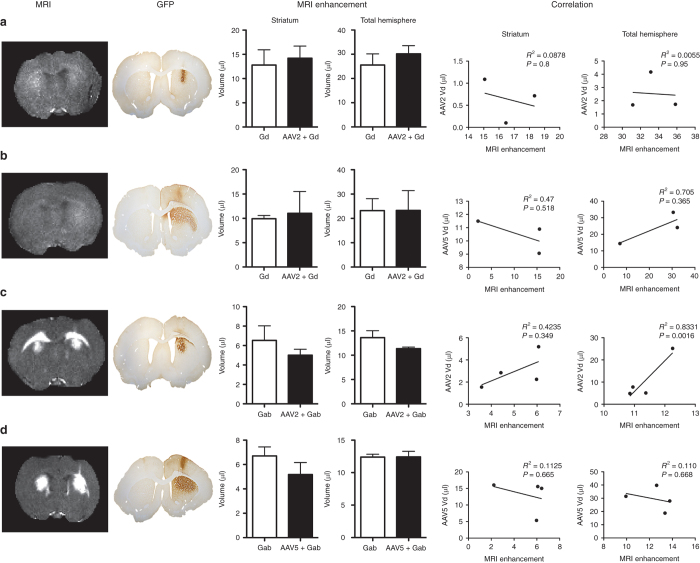
Figure 1.
Effects of Gd and Gab on MRI enhancement and GFP distribution of rAAV2 and rAAV5. The first and second columns show the R1 (=1/T1) maps from the MRI and the corresponding GFP staining for six animals. Note that the GFP is only visible on the side with the viral vector, while the MRI enhancement is bilateral (only the right hemisphere was injected with rAAV-GFP). The plots labeled “MRI enhancement” compare the the volumes enhanced by contrast infusion with (right hemisphere) and without the viral vector (left hemisphere). No statistically significant differences for MRI enhancement were observed between striatal hemispheres or total brain. The plots labeled “correlation” show Pearson’s correlation analysis between the MRI volume of enhancement and the volume of rAAV distribution analyzed for both striatum and total brain. Data expressed as volume ± SEM. n = 4 for all experimental groups, except the Gd/AAV5-GFP (n = 3; one animal was removed from the analysis due to motion artifact). Scale bar = 1 mm. Gab, galbumin; Gd, gadoteridol; GFP, green fluorescent protein; MRI, magnetic resonance imaging; rAAV, recombinant adeno-associated virus.

