Figure 3.
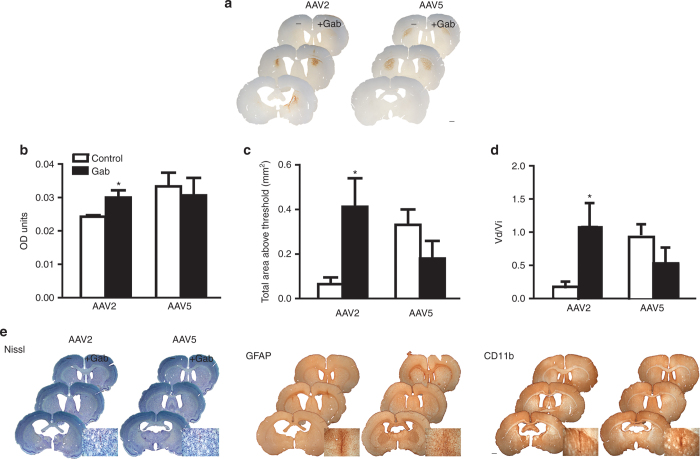
Gab enhances rAAV2 distribution in rat striatum. (a) Left hemispheres were injected with AAV + lactated Ringer’s solution. Right hemispheres were injected with AAV + 0.1 mmol/l Gab. Scale bar = 1 mm. (b–d) Quantification of the effects of Gab in the distribution of rAAV2 and rAAV5 by OD analysis (b) Mean OD of GFP immunoreactivity. (c) Total area above threshold of GFP immunoreactivity and (d) Vd/Vi. (e) Galbumin does not affect tissue health. Nissl staining reveals no cell damage outside of the needle track in both hemispheres (left panel). Immunostaining for markers of inflammation (middle panel: GFAP, a marker of activated astrocytes; right panel: CD-11b, a marker for activated microglia) show no inflammation in either hemisphere outside of the needle track area. For all figure panels in e, right hemispheres were injected with AAV + Gd and left hemispheres with AAV + lactated Ringer’s solution. Insets show representative needle track inflammation and cell damage. Scale bar = 1 mm. Data (b,c,d) represent the mean ± SEM (AAV2 1 mmol/l Gab group, n = 4; AAV5 1mmol/l Gab group, n = 3). *P < 0.05. Significant indicators above histogram bars indicate comparison to control side (no contrast agent) within same treatment group. Gab, galbumin; GFP, green fluorescent protein; OD, optical density; rAAV, recombinant adeno-associated virus.

