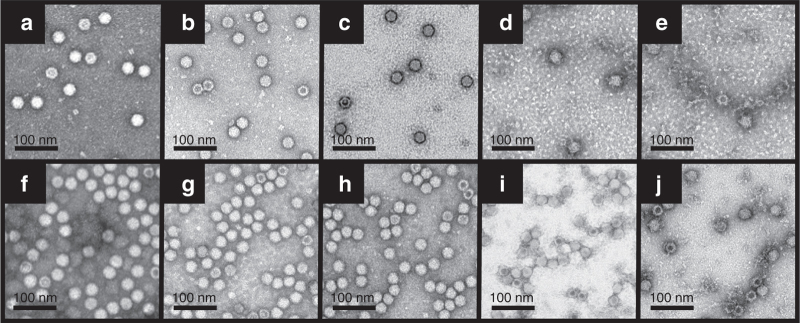
Figure 4.

Comparison of the gross morphology of rAAV2-GFP and rAAV5-GFP before and after treatment with Gd and Gab. EMs of rAAV2-GFP in (a) lactated Ringer’s solution, (b) 1 mmol/l Gd, (c) 2 mmol/l Gd, (d) 0.1 mmol/l Gab, and (e) 0.2 mmol/l Gab. The same treatment was repeated for rAAV5-GFPs, and the EMs are shown in (f) lactated Ringer’s solution, (g) 1 mmol/l Gd, (h) 2 mmol/l Gd, (i) 0.1 mmol/l Gab, and (j) 0.2 mmol/l Gab. The scale bar on each figure is 100 nm. EM, electron microscopy; Gab, galbumin; Gd, gadoteridol; GFP, green fluorescent protein; rAAV, recombinant adeno-associated virus.
