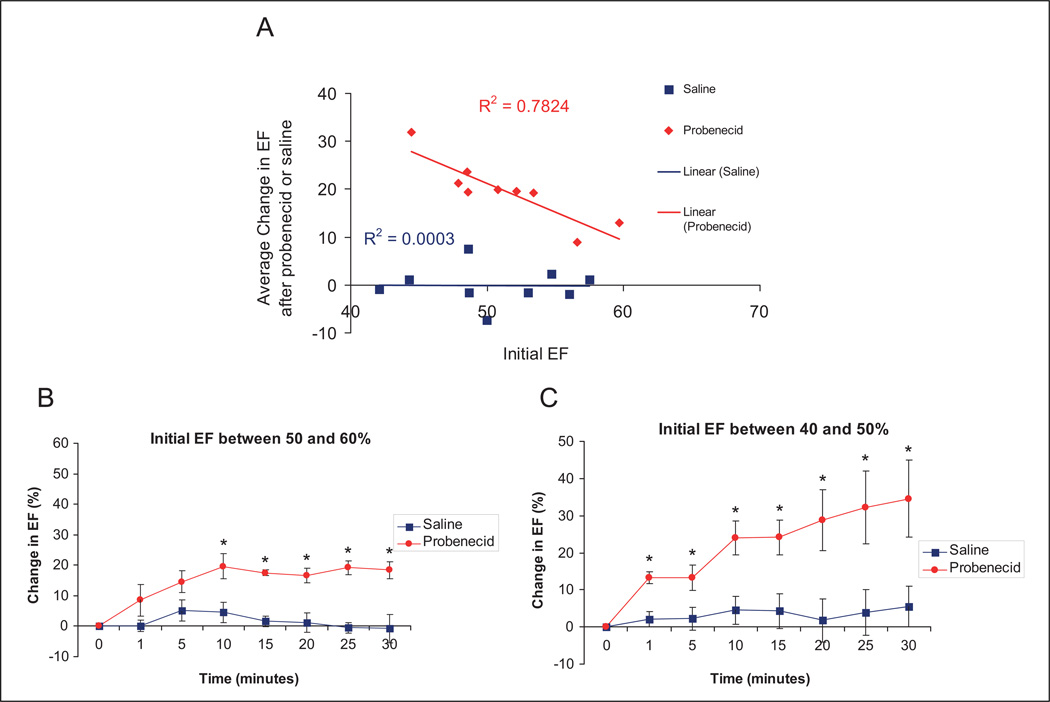
Figure 3.
Average change in EF after intraperitoneal administration of probenecid (100 mg/kg) or saline in mice after I/R injury. The correlation between initial EF (before injection) and the change in EF after probenecid administration (A), and the groups divided by initial EF with 50% to 60% (B) representing minimal damage, and 40% to 50% (C) representing more significant myocardial injury (*P < .05). EF indicates ejected fraction; I/R, infusion/reperfusion.

