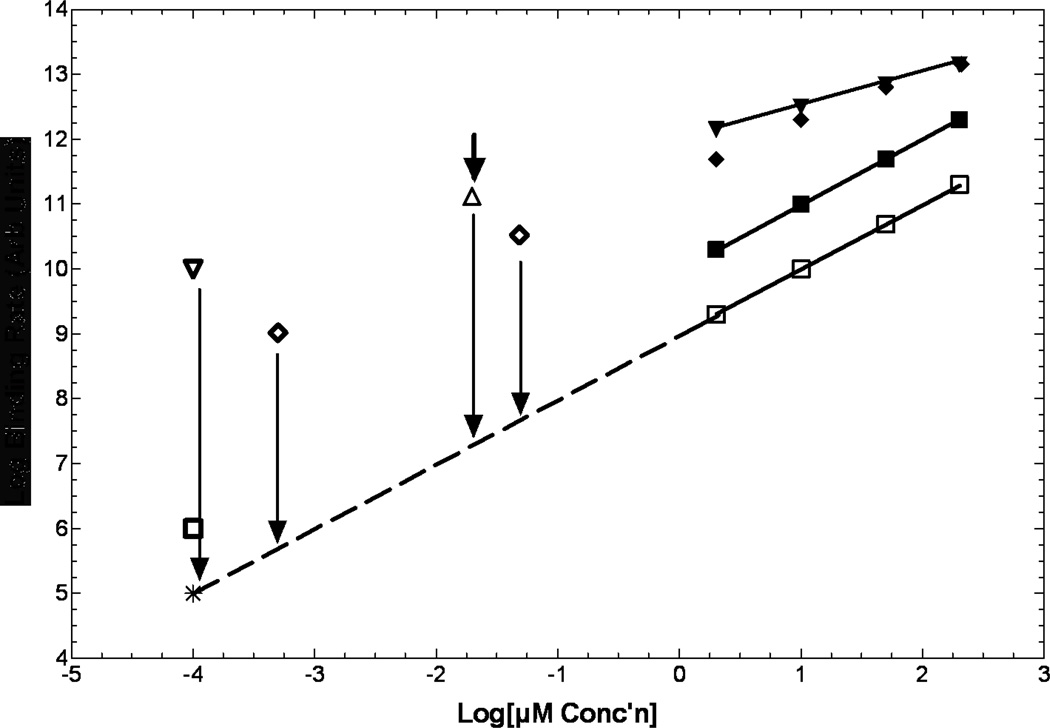
Figure 2.
Kinetics of binding are only known for a few compounds, and at µM to near mM concentrations (upper right). Representation of the shapes of these curves are illustrated for misonidazole (inverted closed triangles), EF5 (closed diamonds) and etanidazole (closed squares). All drugs tested revert to 1st order dependence on drug concentration at low oxygen levels (open squares; 0.2%, etanidazole). Shown at many logs lower concentrations are the low and moderate SA 18F-EF5 (open diamonds), high SA 18F-FMISO (open inverted diamond) and 18F-fluoroetanidazole (open square). The only in vitro data in the high SA range is for 18F-FAZA (open triangle). No current information exists as to whether these extrapolated points mean anything, or what happens between anoxic binding and (for example) 0.2% oxygen (vertcal arrows). Note that this graph spans many decades of concentration for both axes.

