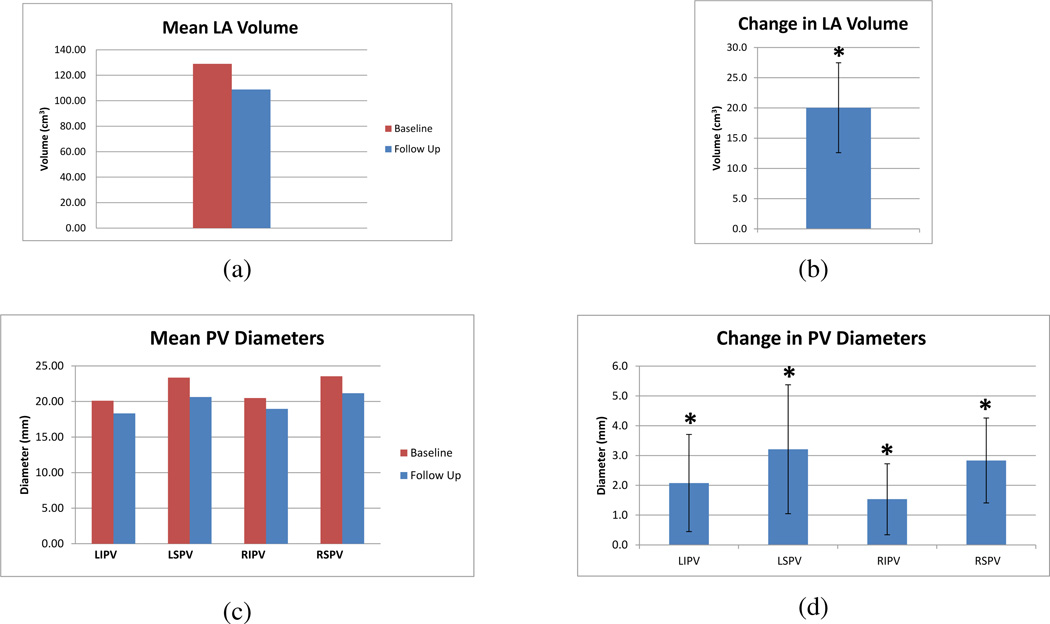
Figure 6.
(a) Mean left atrial volume measured at baseline and three month follow-up. (b) Mean change in left atrial volume following ablation therapy with 95% confidence intervals. The * indicates statistical significance for p < .05. (c) Mean pulmonary vein diameters measured at baseline and three month follow-up. (d) Mean change in pulmonary vein diameters following ablation therapy with 95% confidence intervals. The * indicates statistical significance for p < .05.

