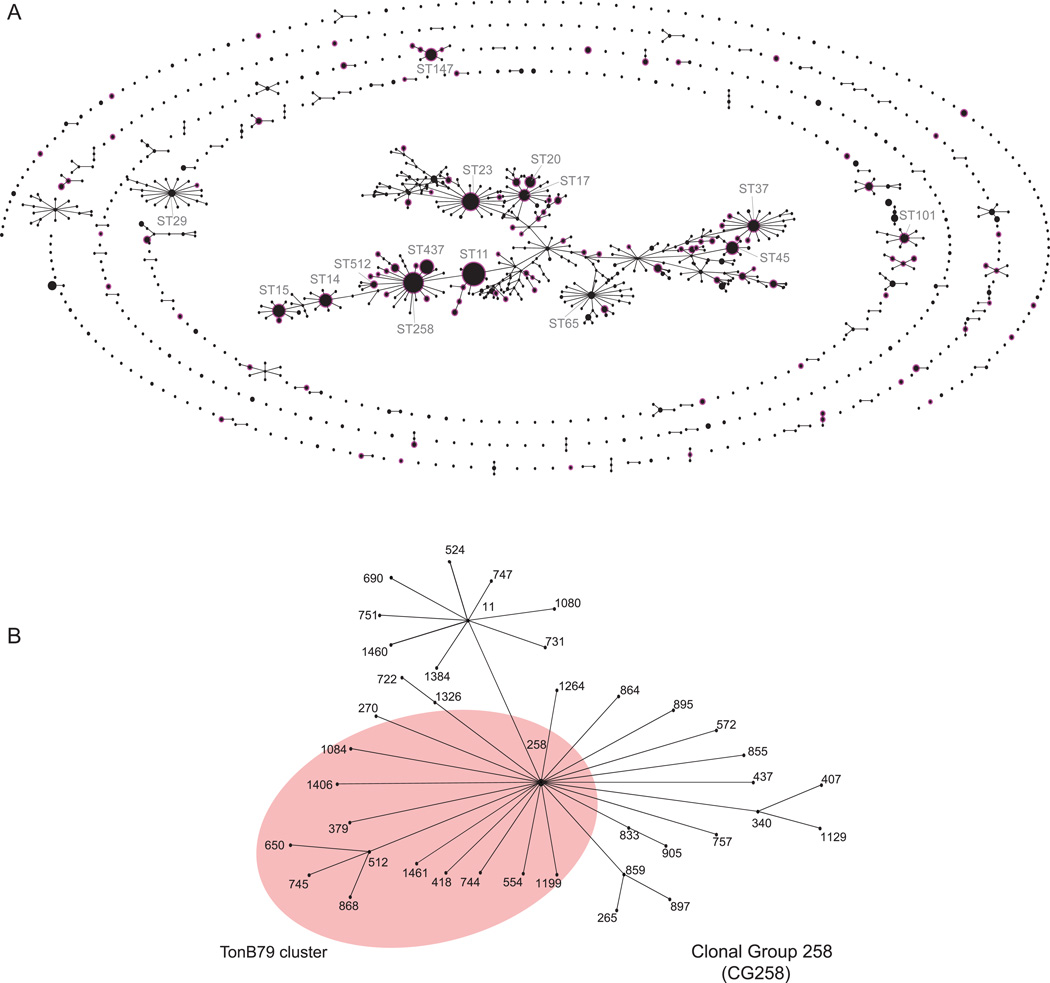
Figure 1.
(A). Population structure of KPC-Kp. The figure represents the population structure of the K. pneumoniae MLST database (http://www.pasteur.fr/mlst) as of April 1, 2014, depicted graphically by eBURST v.3 (http://eburst.mlst.net), and shown in the context of all of the 1,536 STs from 1,924 isolates. KPC-Kp STs are highlighted by a pink halo. (B). Population structure of CG258. The pink shading highlights the STs of CG258-tonB79 cluster.

