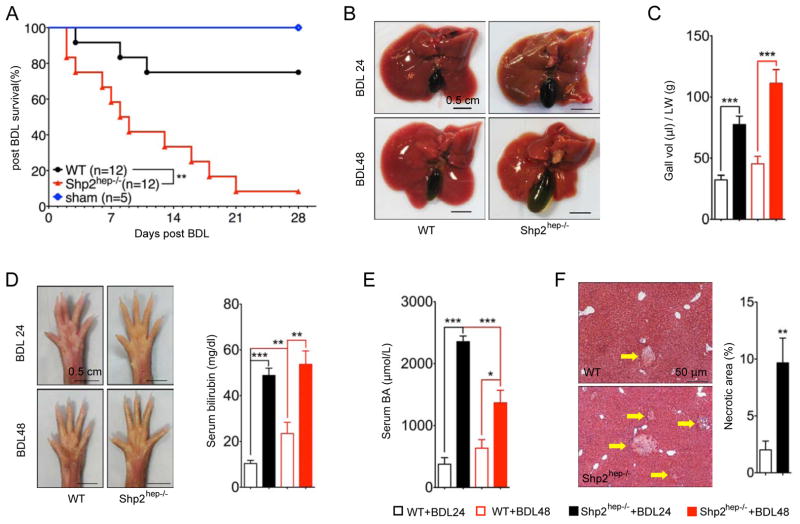
Figure 2. Severe hepatobiliary damages in Shp2hep−/− mice following bile duct ligation.
(A) Kaplan-Meier survival analysis of WT and Shp2hep−/− mice after BDL. ** p = 0.0014, as determined by Log-rank (Mantel-Cox) Test.
(B) Macroscopic views of WT and Shp2hep−/− livers were taken 24 and 48 hrs after BDL.
(C) Gallbladder volumes were adjusted to liver weight after BDL (n = 4–10).
(D) Macroscopic view of palms was shown 24 and 48 hrs after BDL. Serum bilirubin levels were measured (n = 6–12).
(E) Serum BA levels were measured after BDL (n = 6–12)
(F) Liver sections were stained with H&E (left), and statistical analysis (n = 5–7) of necrotic areas (right).
Data in (E, D, E and F) are shown as the mean ± s.e.m. ** p < 0.01 and *** p < 0.001, as determined by Student’s t test.

