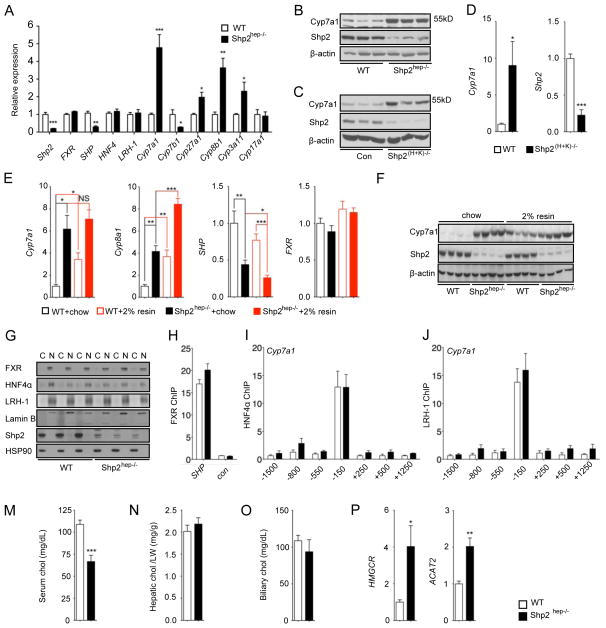
Figure 5. BA synthesis-related genes are significantly up-regulated in Shp2hep−/− liver.
(A) The expression of genes as indicated was determined by qRT-PCR in 2-month-old WT or Shp2hep−/− livers (n = 4–5).
(B) Cyp7a1, Shp2 and β-actin protein levels were determined by immunoblotting of liver lysates from WT and Shp2hep−/− mice. Each lane represents each mouse.
(C) Cyp7a1, Shp2 and β-actin protein levels were determined by immunoblotting of liver lysates from Control and Shp2(H+K)−/− mice. Each lane represents each mouse.
(D) Relative expression of Shp2 and Cyp7a1 was measured by qRT-PCR in liver extracts of WT and Shp2(H+K)−/− mice following poly-I:C injection (n = 5).
(E) Hepatic expression of Cyp7a1, Cyp8b1,SHP and FXR mRNAs was determined by qRT-PCR in mice fed with chow without or with 2% cholestyramine from 3 weeks to 2 months. (n = 4–8).
(F) Cyp7a1, Shp2 and β-actin protein levels were determined by immunoblotting of liver lysates as in (F). Each lane represents each mouse.
(G) Cytoplasmic (C) and nuclear (N) fractions were prepared from freshly-isolated liver samples. FXR, HNF4α, LRH-1, Lamin B (nuclear marker), Shp2 and Hsp90 (cytoplasmic marker) protein levels were determined by immunoblot analysis. Each pair of (C) and (N) samples was prepared from the same mouse.
(H) Chromatin Immunoprecipitation (ChIP) was performed with liver samples (n=3) using FXR antibody. qPCR was performed with FXR binding region on SHP promoter (SHP) and coding region (con). Data are shown as fold enrichment.
(I–J) ChIP assay was performed with HNF4α or LRH-1 antibodies, and different DNA sequences in Cyp7a1 promoter and proximal regions (n=4). Data are shown as fold enrichment.
(M–O) Cholesterol (chol) levels of serum (h), liver (i) and gallbladder (j) were measured. Hepatic cholesterol was adjusted to mg/liver weight (g).
(P) Hepatic expression of HMGCR and ACAT2 mRNA was determined by qRT-PCR (n = 4–5).
All PCR data was normalized against β-actin, and fold change was calibrated to WT group. Data (A, D, F, H, I, J and K) are shown as the means ± s.e.m. * p < 0.05, ** p < 0.01 and *** p < 0.001, as determined by Student’s t test.

