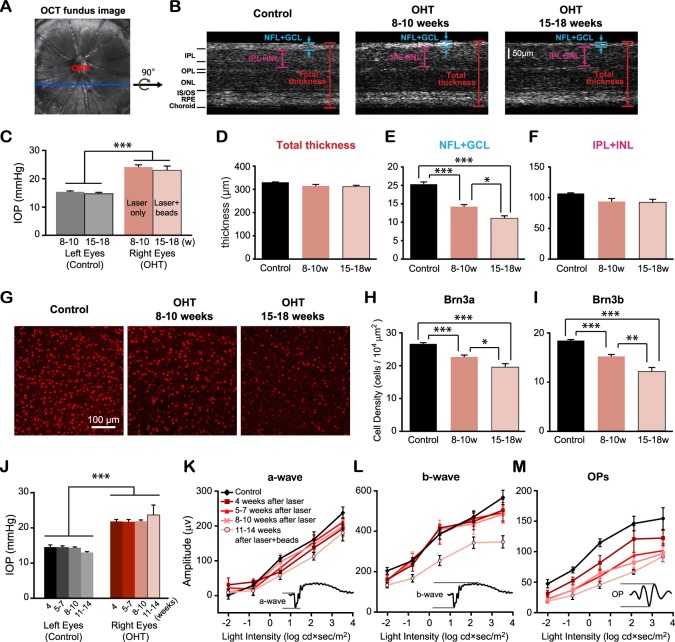
Figure 2.
Retinal ganglion cell loss following chronic IOP elevation. (A) The fundus image obtained by the OCT imaging. ONH, optic nerve head. (B) The cross-sections of retinas from a control eye (left) and OHT eyes at 8 to 10 weeks (center) and 15 to 18 weeks (right). OPL, outer plexiform layer; ONL, outer nuclear layer; IS, inner segment; OS, outer segment. (C) The mean IOP from OHT eyes measured right before OCT was significantly higher than that of control eyes. (D–F) The thickness of the NFL and GCL decreased significantly post IOP elevation (E), but not the total thickness (D) or the thickness of the IPL and INL (F). (G) Flat-mounted retinas immunostained by Brn3b antibody from one control and two OHT eyes. (H, I) The density of RGCs labeled by Brn3a (H) and Brn3b (I) decreased following chronic ocular hypertension. (J) The mean IOP measured right before ERG recordings. (K–M) The mean amplitudes of OPs of laser-treated eyes continued to decrease with time (P < 0.001, two-way ANOVA, Tukey's posttest), but not a- and b-wave for the first 10 weeks (P > 0.7). The mean amplitudes of a- and b-wave were significantly reduced at 11 to 14 weeks following chronic IOP elevation (P < 0.05 for a-wave, and P < 0.001 for b-wave). Insets: Representative ERG waveforms of the a-wave, b-wave, and OPs. For (C–F) and (H–J): *P < 0.05. **P < 0.01. ***P < 0.001 in Student's t-test.

