Figure 3.

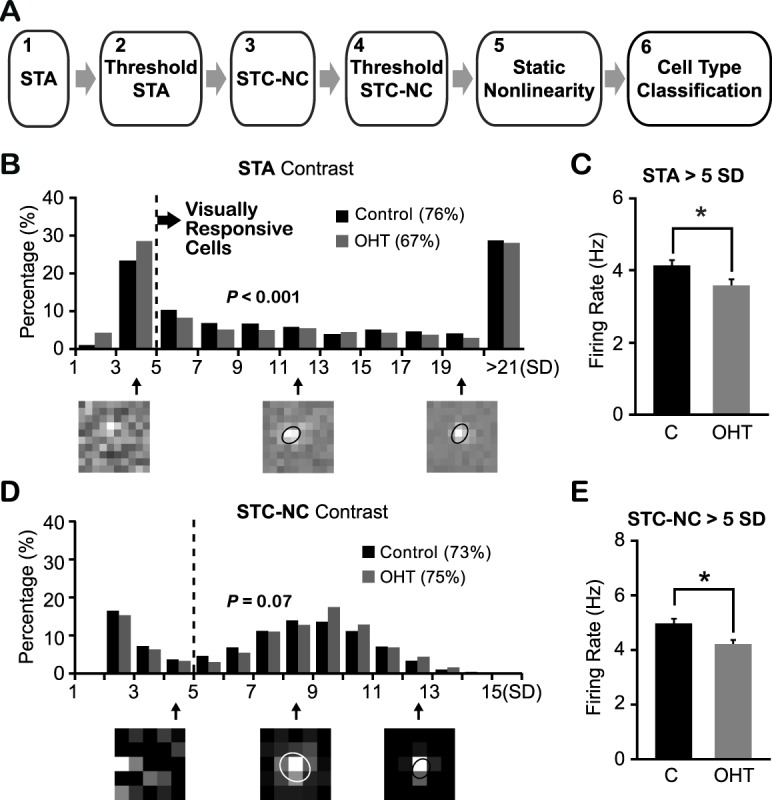
Ocular hypertensive eyes had fewer visually responsive RGCs than controls. (A) Schematic diagram of the characterization of different functional subtypes of RGCs. (B) Distributions of STA contrast of RGCs from OHT eyes and age-matched controls. Dashed line indicates the cutoff value (5 SD) to define visual responsiveness. Three examples of STA peak frame shown underneath and the cell with STA contrast below 5 SD lacked a defined RF structure. The ellipses illustrate the RF center locations and sizes (with 1-SD Gaussian contour). P < 0.001 in χ2 test. (C) Mean firing rate of visually responsive RGCs was smaller in OHT eyes than controls. *P < 0.05 in Student's t-test. (D) Distributions of STC-NC contrast of visually responsive RGCs from hypertensive and control eyes. Dashed line: The cutoff value (5 SD) for static nonlinearity analysis (step 5) and cell-type classification (step 6). P = 0.07 in χ2 test. Bottom: Examples of STC-NC peak frame. (E) The mean firing rate of RGCs with STC-NC contrast larger than 5 SD from OHT eyes was significantly smaller than that of controls. *P < 0.05 in Student's t-test.
