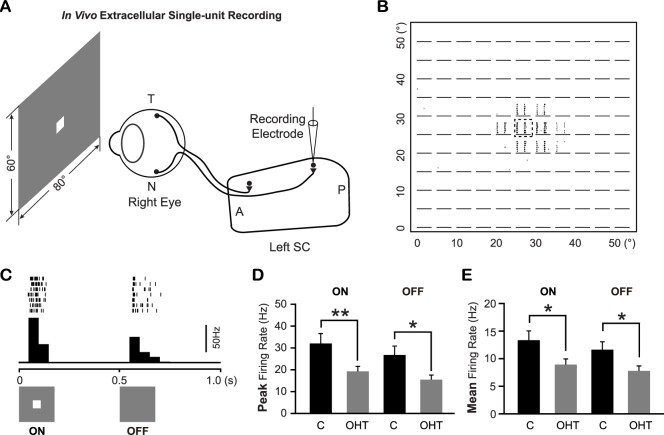
Figure 5.
Superior colliculus neurons in OHT mice exhibited lower responses to spot flashed on their RFs than controls. (A) Schematic diagram of the in vivo extracellular single-unit recording of SC neurons in mice. T, temporal; N, nasal; A, anterior; P, posterior. (B, C) The representative raster plots of the spikes recorded from an SC neuron in response to a 5° spot flashed at different locations (11 × 11 grids). The details of the raster plot marked by a dashed square were shown in (C) with the peristimulus time histogram shown below. (D, E) The peak firing rate (D) and mean firing rate (E) of ON and OFF responses of SC neurons in OHT mice and age-matched controls. *P < 0.05. **P < 0.01 in Student's t-test.

