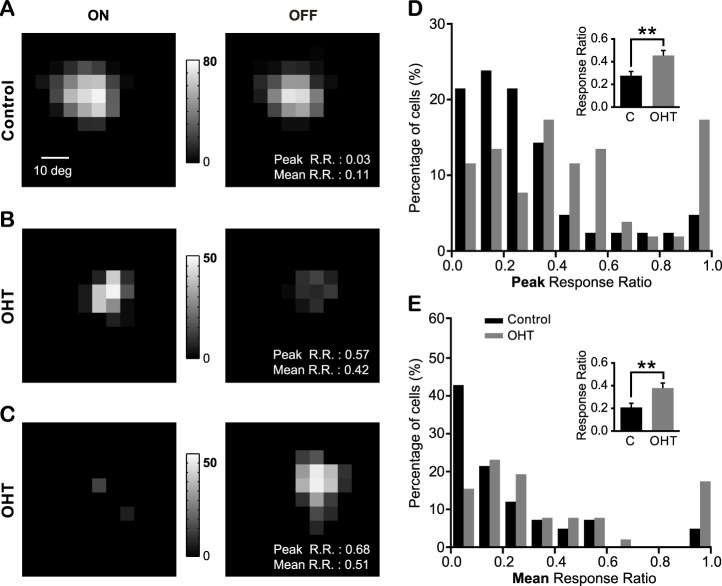
Figure 6.
The balance of the ON and OFF responses of individual SC neurons was disrupted in OHT mice. (A–C) Representative maps of responses to spot flashed on the RF of one control SC cell (A) and two cells from OHT mice (B, C). The gray scales illustrate the neurons' firing rates (spikes/s). (D, E) The distribution of the peak response ratio (D) and mean response ratio (E) from OHT and control mice. Zero indicates identical firing rates to both ON and OFF stimulation, and one indicates a preferred response to either ON or OFF. Inserts, mean of the peak and mean response ratio. **P < 0.01 in Student's t-test.

