Figure 7.
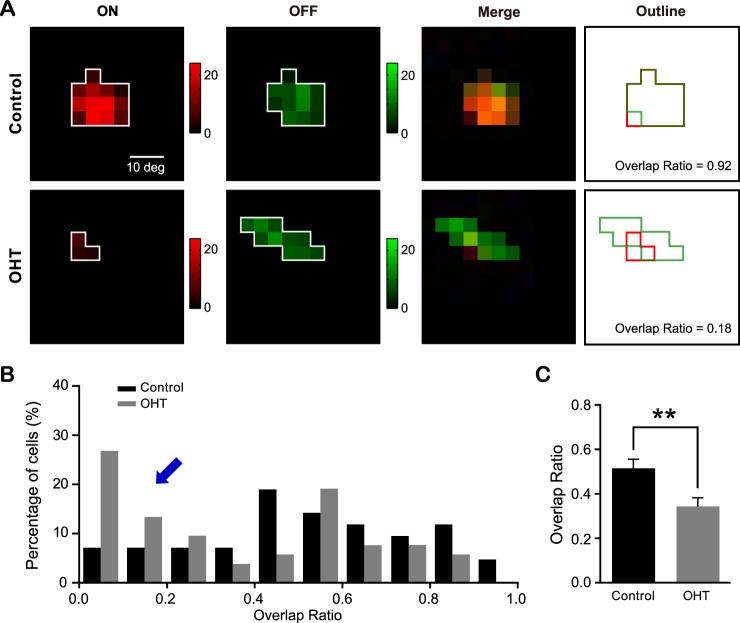
The ON and OFF subfields of individual SC neurons were mismatched in OHT mice. (A) ON (red) and OFF (green) subfields of SC neurons from a control (top) and an OHT (bottom) mouse. (B) The distributions of overlap ratio from OHT mice and age-matched controls. The overlap ratio ranges from 0 to 1, with a value of 1 indicating complete ON-OFF overlap and 0 no overlap. The blue arrow points to the increased number of SC neurons with low or no overlap of ON and OFF subfields in OHT mice. (C) Mean overlap ratio from OHT mice was smaller than age-matched controls. **P < 0.01 in Student's t-test.

