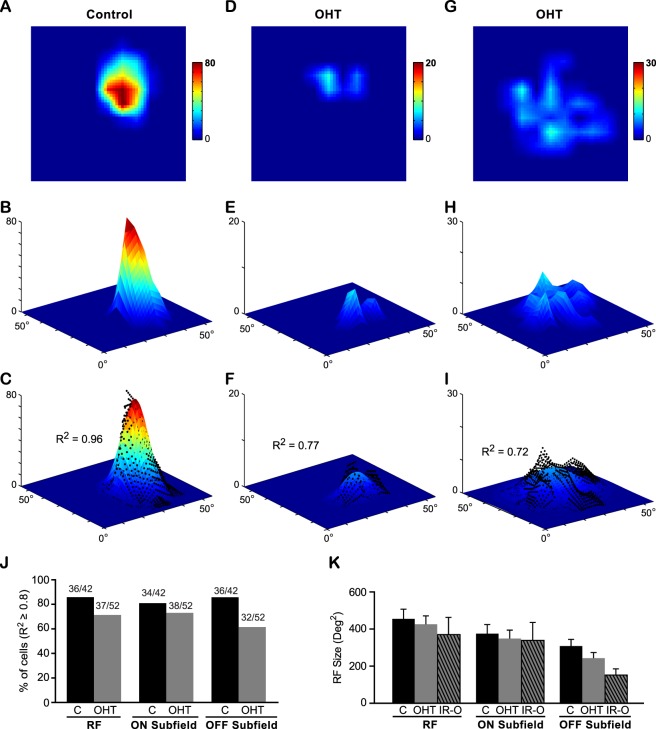
Figure 8.
More SC neurons in OHT mice exhibited a patchy RF structure compared with the age-matched controls. (A–I) The RF structure of SC neurons from a control mouse (A–C) and two OHT mice (D–I). (A, D, G) The RFs were smoothed by linear interpolation from 11 × 11 grids to 55 × 55 grids. The color scales represent the neurons' firing rates (spikes/s). Note the firing rates were much lower in OHT mice (D, G). (B, E, H) 3D plots of the RF (with the same color scales shown above, and z-axis also represents the firing rates). (C, F, I) The RF was fitted by a 2D Gaussian function. The black dots represent the original RF map from (B, E, H). The value of R2 was used to quantify the goodness of fit, with R2 ≥ 0.8 corresponding to a Gaussian-shaped RF structure and R2 < 0.8 to a patchy RF structure. (J) The percentages of cells with R2 ≥ 0.8. More cells in the OHT mice showed poor 2D Gaussian function fits. (K) The receptive field size of SC neurons in OHT mice and age-matched controls were not significantly changed. IR-O, cells with irregular RF structure (R2 < 0.8) from OHT mice. P > 0.05 in one-way ANOVA test.

