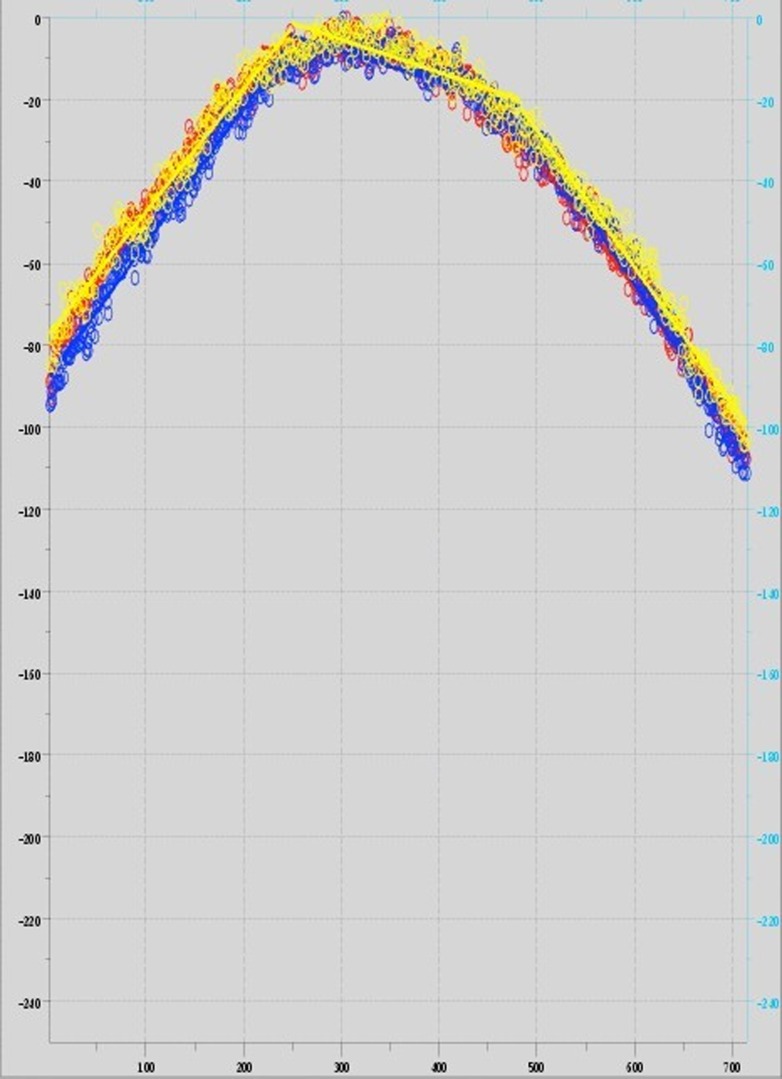
Figure 4.
Plotted intensity data and the line segments [upper left to lower right (red); upper right to lower left (blue); and a center horizontal line (yellow)] for Microscope AM (see Supplemental Data for more information on this scope), exhibiting a quasiparabolic illumination profile and demonstrating the fit of the 3 line-segment approximations.

