Figure 1.
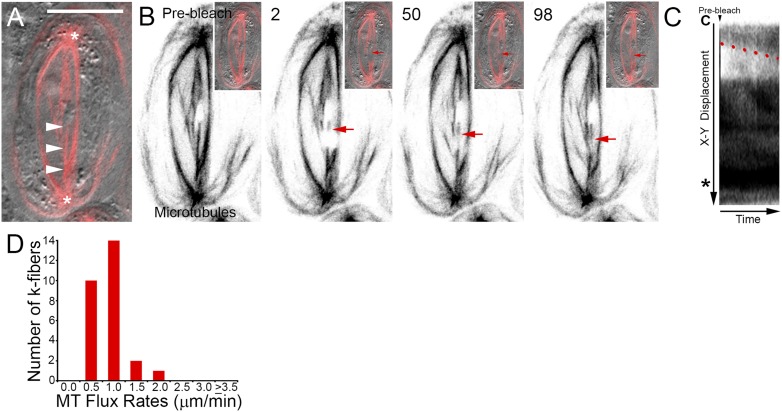
Drosophila primary spermatocyte kinetochore fibers undergo microtubule flux during metaphase. A) Dual channel scanning confocal image showing spindle morphology and chromosome position. MTs labeled with EGFP are shown in red, and the DIC transmitted light image is in gray. Arrowheads denote the k-fiber of interest, (*) indicates centrosomes. Scale bar is 10 µm. B) Selected frames taken from a time-lapse sequence of the cell shown in A. At the onset of the experiment, the k-fiber is homogeneously fluorescent. After photobleaching, a nonfluorescent bar is visible (arrow) that can be tracked as it moves progressively polewards (2–98). Insets show corresponding composite EGFP and DIC images. Time is in seconds relative to the photobleaching event. C) Kymograph of the photobleached k-fiber. Over time, the bleached region travels away from the chromosome (C) and toward the centrosome (*). No change in k-fiber length occurs as the mark moves. The rate of flux can be calculated from the slope of the line (red) delineating the displacement of the bleached zone. D) Distribution of metaphase flux rates.

