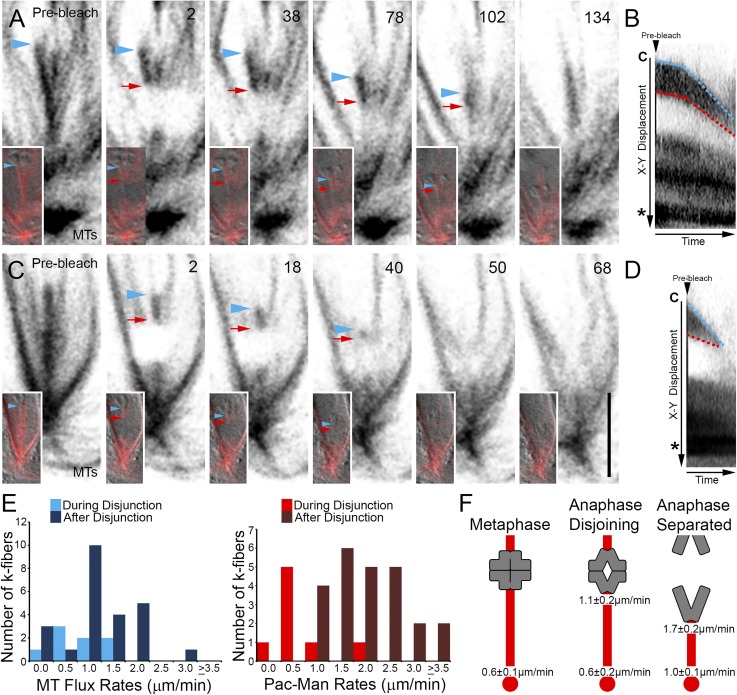
Figure 2.
Drosophila primary spermatocyte chromosomes segregate by Pac-Man and flux mechanisms. A) Selected frames taken from a time-lapse sequence of a cell entering and progressing through anaphase A. Insets show MTs overlaid on the DIC image. The k-fiber plus end and chromosome position is denoted by blue arrowheads, the boundary of the bleach region is indicated by red arrows. After the photobleaching event, the chromosome and bleached mark move polewards (2–134). The chromosome approaches the bleached mark before the k-fiber signal is lost. Time is in seconds relative to photobleaching. B) Kymograph of the photobleached k-fiber in A. The separation distance between the chromosome (C) and bleached mark decreases as both move toward the pole and centrosome (*) revealing k-fiber plus end depolymerization (Pac-Man) and minus end MT flux. Demarcation of the k-fiber’s plus end (blue lines) and that of the bleached region (red lines) indicate distinct slow and fast k-fiber dynamic phases. C) Selected frames from a time-lapse series of an anaphase cell following chromosome disjunction. Similar to A, as the chromosome (blue arrowheads) segregates, it overtakes the polewards moving bleached mark (red arrows), demonstrating Pac-Man and flux activities. Time is in seconds relative to the photobleaching event. Scale bar is 5 µm. D) Kymograph of the photobleached k-fiber in C confirms the rapid shortening of the k-fiber plus end adjacent to the chromosome (C; blue line) by Pac-Man while the entire k-fiber shortens at the minus end drawing the bleached fiducial mark toward the centrosome (*) as it undergoes MT flux. E) Distribution of MT flux and Pac-Man rates during chromosome disjunction and after their separation. F) Graphical summary of the kinetic findings of this study. K-fibers are shown in red and chromosomes in gray. Numbers are the average local depolymerization rates for k-fiber MT plus or minus ends during the indicated period.

