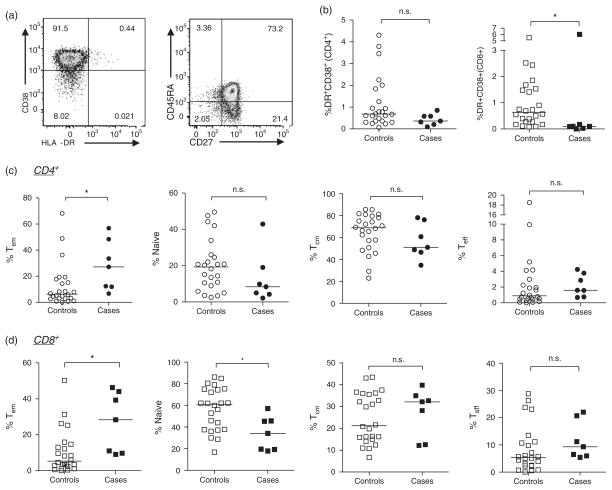
Fig. 4. CD4+ and CD8+ T-cell activation and maturation status in cryopreserved cord blood mononuclear cell by subsequent HIV-1 acquisition.
CD4+ or CD8+ lymphocytes were assessed for activation and maturation status by expression of HLA-DR and CD38 (a, left) as well as CD27 and/or CD45RA (a, right). Activation of CD4+ (b, circles, left) and CD8+ (b, squares, right) T cells between cases and controls as well as the proportion of cells in maturation states (from left to right): effector memory (CD27−CD45RA−), naive (CD27+CD45RA+), central memory (CD27+CD45RA−) or effector (CD27−CD45RA+) CD4+ T cells (c) or CD8+ T cells (d). CD4+ T cells are represented by circles and CD8+ T cells are represented by squares; controls are open symbols, cases, closed symbols. Lines represent medians for each group, and statistics were generated using a Mann–Whitney test (*P <0.05, n.s. P >0.1).

