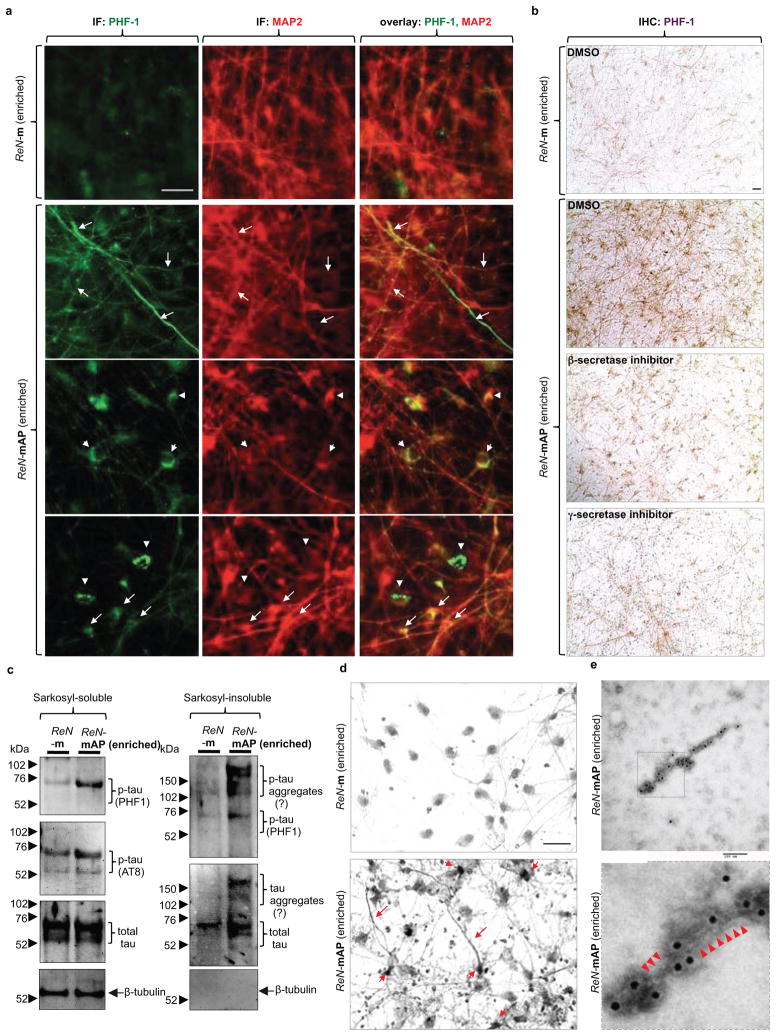
Figure 4. Detection of aggregated p-tau in the enriched ReN-mAP cells.
a. IF of p-tau and MAP2 in the enriched ReN-mAP and ReN-m cells after 3D differentiation (green, p-tau (PHF1); red (pseudo-colored), MAP2; scale bar, 25 μm; arrows, p-tau positive neurites; arrowheads, p-tau positive cell bodies). b. IHC of p-tau in the enriched ReN-mAP and ReN-m cells after 10-week 3D differentiation. The cells were treated with 1 μM BACE1 Inhibitor IV, 3.7 nM compound E or DMSO for the final two weeks of the 3D differentiation. PHF1 antibody detected the elevated levels of p-tau in soma and neurites (brown, p-tau; scale bar, 25 μm). c. WB of total and p-tau levels in 1% sarkosyl-soluble and -insoluble fractions. d. The modified Gallyas silver staining showed robust increases of strong silver deposits in cell bodies and neurite-like structures in the enriched ReN-mAP cells (lower panel) but not in ReN-m cells (upper panel; scale bar, 25 μm). e. Tau filaments were detected in sarkosyl-insoluble fractions from the enriched ReN-mAP cells by transmission electron microscopy (7-week 3D differentiation; black dots, anti-tau (tau46) antibodies labeled with immunogold anti-mouse antibodies; scale bar, 100 nm). Lower panel: an enlarged image (arrowheads indicate filamentous structures).

