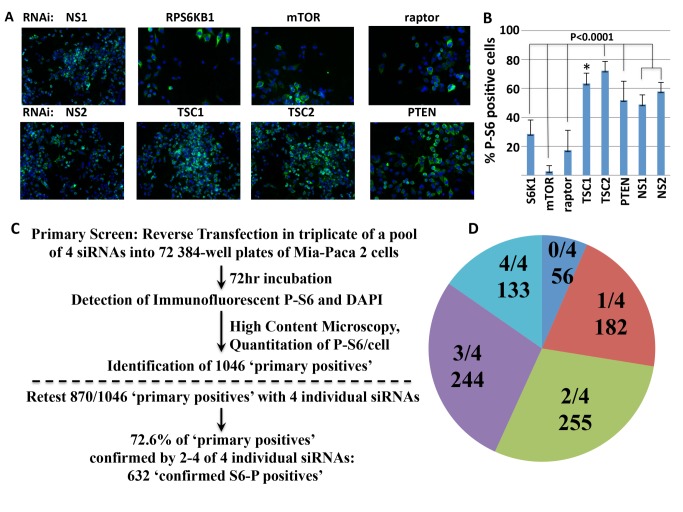
Fig 1. High-throughput image-based screens for genes regulating the phosphorylation of rpS6.
A. Immunofluorescence analysis (IF) of rpS6Ser(235/236) phosphorylation. Mia-Paca 2 cells were transfected in 384-well plates with a control, nonspecific RNAis NS1 (upper panel) and (NS2) (lower panel), and RNAi pools directed at S6K, TOR and Raptor, TSC1, TSC2 and PTEN. After 72 hours they were fixed, permeabilized and stained by using a rabbit monoclonal anti-S6-P(Ser 235/236) primary antibody, detected with secondary anti-rabbit Alexa 488 antibody (green). Nuclei are stained with DAPI (blue). Representative images are shown. B. Quantitation of cytoplasmic S6-P levels. The bars indicate the % of total MIA PaCa-2 cells (estimated by nuclear count) that exhibit cytoplasmic S6-P immunofluorescence at an intensity above an arbitrary threshold (% S6-P positive cells; see methods). The z’ is 0.31 for the combined use of NS1 and NS2; because NS2 gave consistently higher z’ than NS1 (e.g., 0.45 vs 0.32 for the experiment shown) NS2 was used exclusively in the primary screen; error bars represent 1S.D. * = p<0.01. C. Flow chart of the primary screen: Summary of the screening, hit analysis and hit selection. 21,121 genes were tested using RNAis composed of pools of 4 RNAi oligos (Dharmacon Library); 72 384-well plates were screened in triplicate (See Table 1). The criteria for a “primary positive” are described in the text (Table 2 lists genes not scored due to severe inhibition of proliferation). D. Results of the confirmation screen. From the 1046 “primary positives”, 870 genes, including all 161 positive kinases and the top 709 ranked by Q (S3 Table), were examined in a confirmation screen wherein each of the four RNAis was tested individually. The pie chart indicates how many of the potential positive hits were confirmed by 0–4 individual siRNAs (listed in S4 Table).

