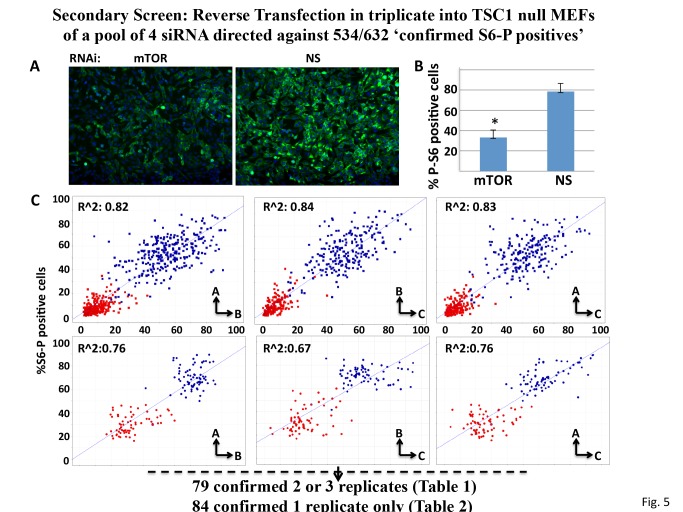
Fig 5. Performance Properties of the siRNA Screen using TSC1 null MEFs.
A. Representative Immunofluorescence images of rpS6Ser (235/236) phosphorylation in TSC1 null MEFs transfected with nonspecific (NS) or mTOR-directed siRNAs. The cells were stained with DAPI (blue) and for rpS6(Ser 235P/236P) (green) as in Fig. 1A. B. Quantitation of “%S6-P positive cells” for the TSC1 null MEFs treated with nonspecific (NS) or mTOR-directed siRNAs. Values represent the average of 42 replicate wells +/- 1S.D, for each NS and mTOR siRNA; *p = 0.05 based on two-tailed student’s t-test. C. Comparison of MiaPaCa cells (upper three plots) and into TSC1 null MEFs (lower three plots) for “%S6-P positive cells” after transfection with nonspecific (blue squares) and mTOR (red squares) siRNA. Scatter plots comparing the positive (mTOR) and negative (NS) controls among replicate plates The MEFs exhibit higher average initial “%S6-P positive cells” but less potent and more variable suppression of “%S6-P positive cells” by mTOR siRNA.

