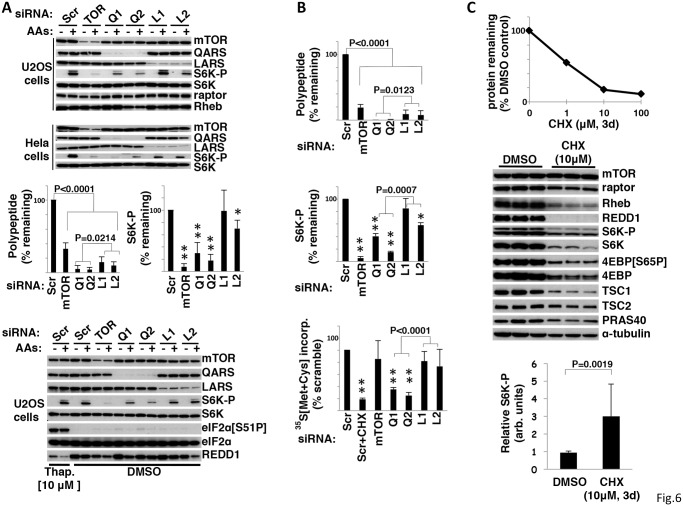
Fig 6. siRNA-mediated depletion of QARS inhibits mTORC1 signaling.
A. The effect of mTOR, QARS and LARS siRNA upon polypeptide knockdown and S6K-Thr389 phosphorylation. U2OS and Hela cells were transfected with siRNA oligos against mTOR, QARS (Q1,Q2), LARS(L1,L2) and a scramble control. After 72h amino acids were withdrawn for 2 hours and added back for 15 minutes as indicated. Cells extracts were subjected to SDS-PAGE and membranes were immunoblotted with the antibodies as indicated. The bar graphs display the combined results of three experiments (mean-/+ 1 S.D.; ** = p<0.0001 and * = p<0.002 vs scramble) The experiment shown in the bottom panels compares the effects of Thapsigargin (10M) with the indicated siRNAs on S6K-P (fourth from top), eIF2α(Ser51-P) (third from bottom) and the abundance of REDD1 (bottom). B. siRNA-mediated depletion of QARS inhibits global protein synthesis. Graphical representation of the combined results from three experiments (mean-/+ 1 S.D.) examining the effect, relative to scramble siRNA, of siRNA against mTOR, QARS and LARS on the abundance of the target polypeptides (upper), the relative phosphorylation of S6K-P (middle; ** = p<0.0001 and * = p<0.002 vs scramble) and on overall protein synthesis (bottom) in nutrient and serum replete U2OS cells. Analyses were carried out three days after transfection. 35S[Methionine+cysteine] was added two hours before harvest; cycloheximide (CHX, 100μM) or carrier was added 30′ prior to 35S. C. The effect of inhibiting translation for three days on mTORC1 signaling. Graphical representation of a dose response of cycloheximide (CHX) on global protein synthesis in U2OS cells. U2OS cells were plated in DMEM with 10% FCS +/- CHX and fresh media containing carrier or CHX was added every 24 hours for 72 hours. The cell were harvested at 72 hours; protein content expressed as a fraction of carrier control is plotted in the upper graph. Immunoblots of cell extracts for the proteins indicated are shown in the middle and the ratio of S6K-P/S6K (mean-/+ 1 S.D.) is shown in the bar graph at the bottom.

