Figure 4.
PLB-induced autophagic cell death in PC-3 and DU145 cells.
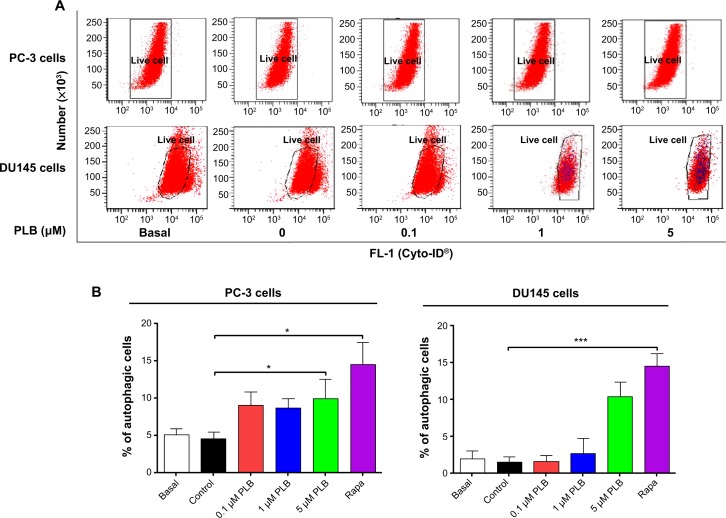
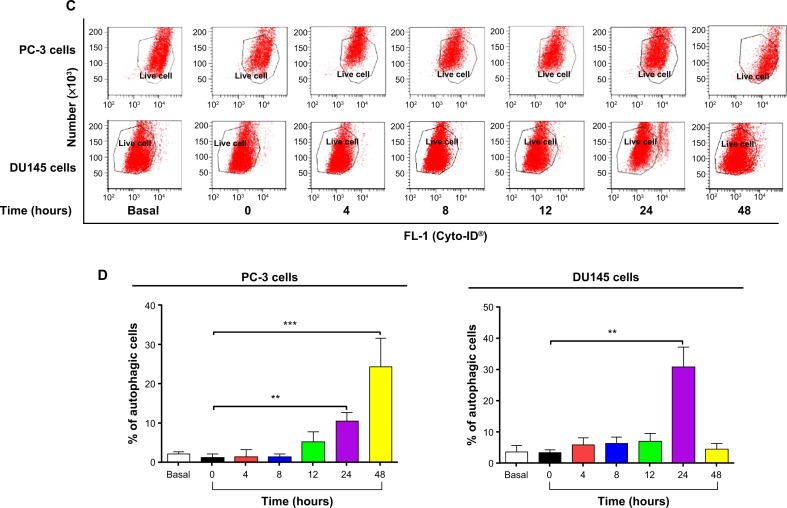
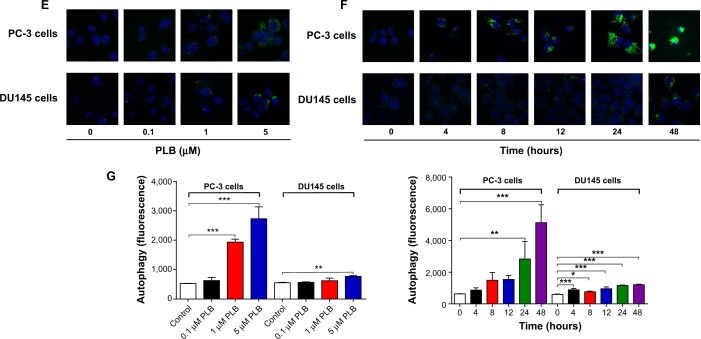
Notes: Flow cytometric plots (A) and bar graphs (B) showing the percentage of autophagic PC-3 and DU145 cells treated with PLB at 0.1 μM, 1 μM, and 5 μM for 24 hours. Flow cytometric plots (C) and bar graphs (D) showing the percentage of autophagic cells in PC-3 and DU145 cells treated with PLB at 5 μM over 48 hours. (E) Confocal microscopic images showing autophagy in PC-3 and DU145 cells treated with PLB at 0.1 μM, 1 μM, and 5 μM for 24 hours (stained in green). The level of autophagy was evaluated using the autophagic vacuole-specific green fluorescent dye, Cyo-ID®. (F) Confocal microscopic images showing autophagy in PC-3 and DU145 cells treated with PLB at 5 μM over 48 hours (stained in green). (G) Bar graphs showing the percentage of autophagic PC-3 and DU145 cells treated with PLB at 0.1 μM, 1 μM, and 5 μM for 24 hours or PLB at 5 μM for 48 hours. Data represent the mean ± SD of three independent experiments. *P<0.05; **P<0.01; and ***P<0.001 by one-way ANOVA.
Abbreviations: ANOVA, analysis of variance; PLB, plumbagin; SD, standard deviation.


