Figure 8.
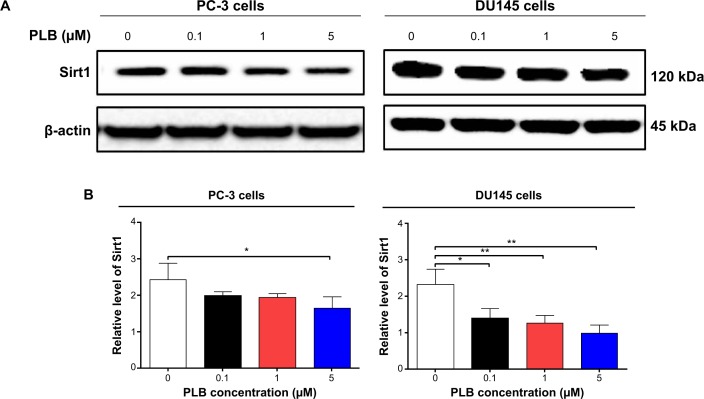
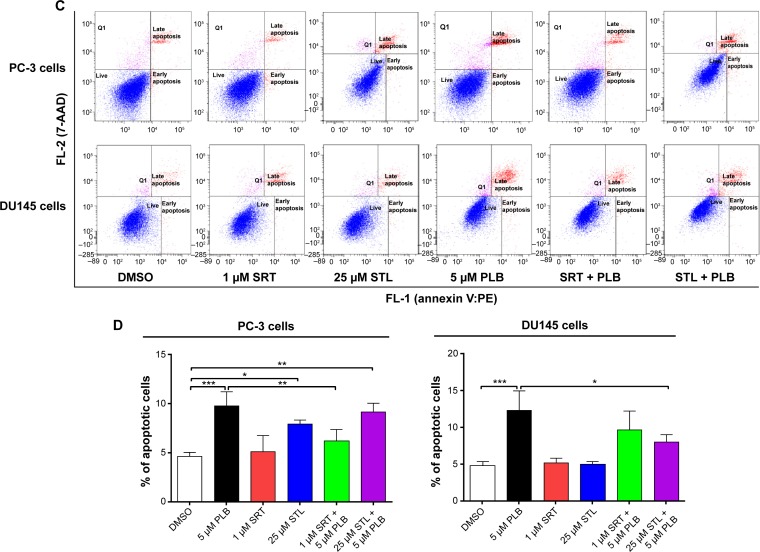
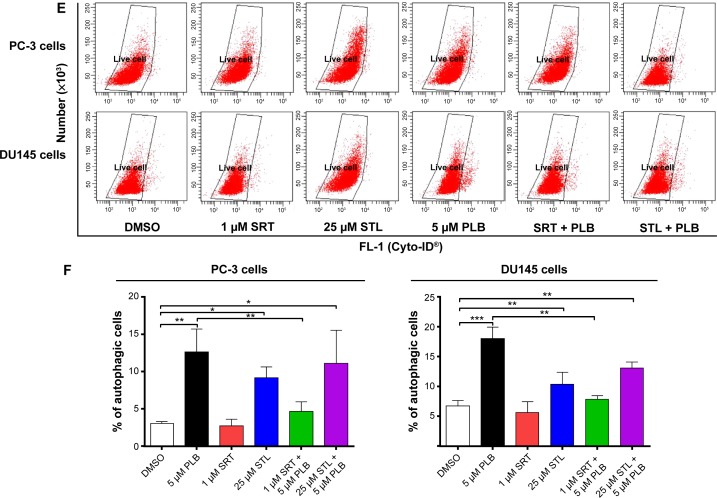
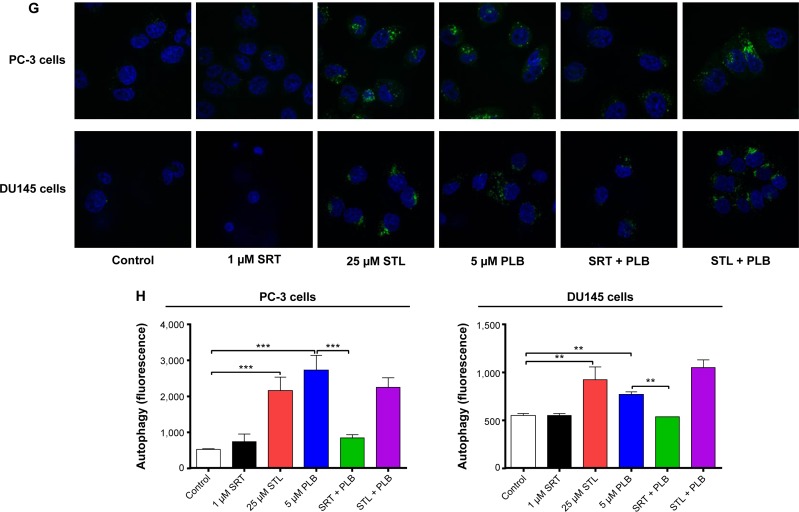
Sirt1 plays a role in PLB-induced apoptosis and autophagy in PC-3 and DU145 cells.
Notes: (A) PLB downregulating Sirt1 in PC-3 and DU145 cells as shown by Western blotting assay. Cells were treated with PLB at 0.1 μM, 1 μM, or 5 μM for 24 hours. (B) The bar graph shows the relative expression level of Sirt1 in PC-3 and DU145 cells. (C) Effects of the Sirt1 inducer SRT (1 μM) and inhibitor STL (25 μM) on PLB-induced apoptosis in PC-3 and DU145 cells. : (D) Bar graphs showing the effects of the Sirt1 inducer SRT (1 μM) and inhibitor STL (25 μM) on PLB-induced apoptosis in PC-3 and DU145 cells. (E) Representative flow cytometric dot plots showing the effects of the Sirt1 inducer SRT (1 μM) and inhibitor STL (25 μM) on PLB-induced autophagy in PC-3 and DU145 cells. (F) Bar graphs showing the effects of the Sirt1 inducer SRT (1 μM) and inhibitor STL(25 μM) on PLB-induced autophagy in PC-3 and DU145 cells. (G) Effects of the Sirt1 inducer SRT (1 μM) and inhibitor STL (25 μM) on PLB-induced autophagy in PC-3 and DU145 cells as shown in confocal microscopic images (G) and bar graphs (H) using the autophagy-associated vacuole-specific fluorescence dye, Cyto-ID®. Data are the mean ± SD of three independent experiments. *P<0.05; **P<0.01; and ***P<0.001 by one-way ANOVA.
Abbreviations: ANOVA, analysis of variance; DMSO, dimethylsulfoxide; PLB, plumbagin; STL, sirtinol; SD, standard deviation; WM, wortmannin; 7-AAD, 7-aminoactinomycin D; PE, phycoerythrin.


