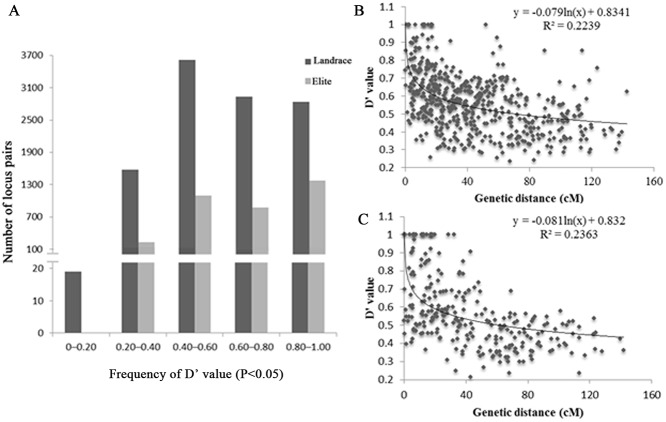
Fig 3. Linkage disequilibrium analysis for landraces and elite varieties.
(A) Frequency of D′ value in landrace and elite. (B) Relationship between the D′ value and genetic distance of syntenic marker pairs in population of landraces. (C) Relationship between the D′ value and genetic distance of syntenic marker pairs in population of elite varieties.

