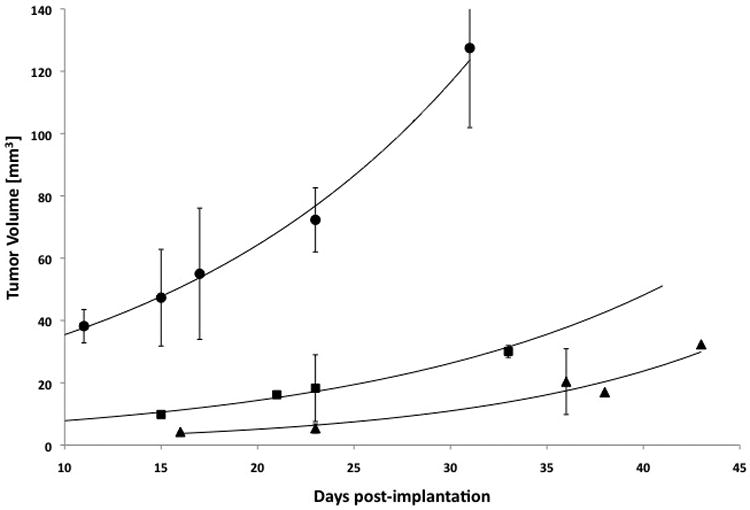
Fig. 1. LNCaP, C4-2, and PC-3 xenograft growth curves.

Increase in tumor volume versus days post-implantation of LNCaP, C4-2, or PC-3 cell deposits. Circle = PC-3, Square = C4-2, and Triangle = LNCaP with n = 5, 2, and 3 respectively.

Increase in tumor volume versus days post-implantation of LNCaP, C4-2, or PC-3 cell deposits. Circle = PC-3, Square = C4-2, and Triangle = LNCaP with n = 5, 2, and 3 respectively.