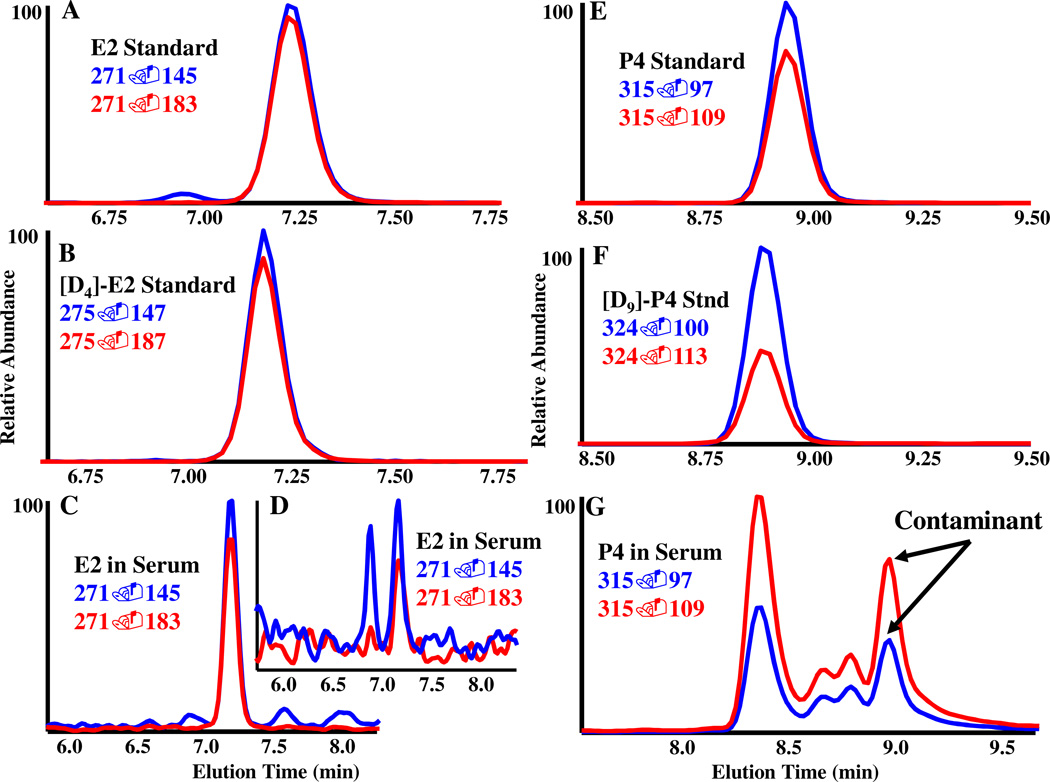
Figure 1.
Data comparison highlighting the mass spectrometric method’s criteria. A quantifiable compound (E2) and a compound of interest (P4) with a confounding co-eluting compound are used as examples to demonstrate the method’s ability to accurately quantitate steroids of interest. All spectra are from LC-MS/MS MRM of E2 and P4. A Representative spectra illustrating the two mass transitions for qualifying and quantitating E2 and B the stable isotope [D4]-E2. C Endogenous E2 in postmenopausal serum at a higher concentration (83 pg/ml) and D at a lower concentration (9 pg/ml). E Representative MRM spectra of mass transitions used to qualify and quantitate P4 and F [D9]-P4. G Representative spectra for the P4 transitions m/z 315→97/109 in serum samples. Notice the multiple mass transitions that co-elute with P4 at 9 minutes. The ratio of the two mass transitions was drastically different than the standards in E and resulted in exclusion of P4 because it could not be differentiated from the co-eluting compound(s).

