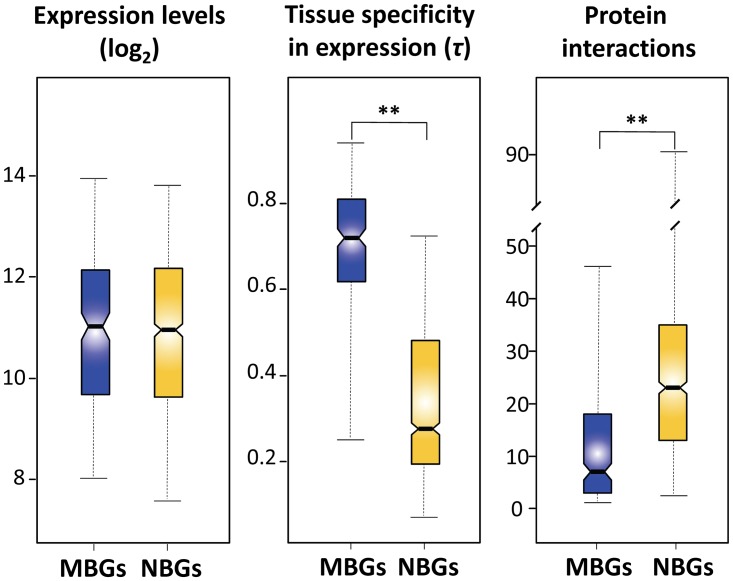
Fig 2. Comparisons of gene expression levels, tissue specificity in gene expression, and number of protein interactions between X-linked MBGs (blue) and X-linked NBGs (yellow).
Asterisks indicate statistically significant differences (Mann-Whitney U test; P < 1×10-32 for tissue specificity and P = 7.3×10⁻²⁹ for protein interactions). (See Fig. 1 legend for explanation of box plots.)

