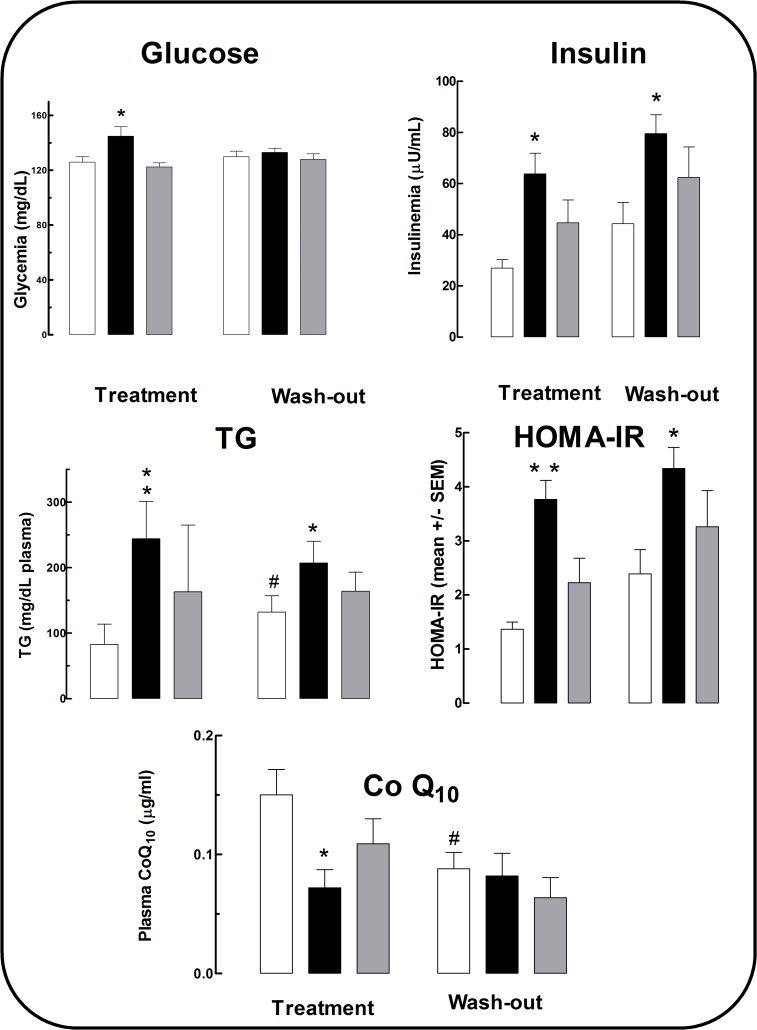
Fig 1. Blood chemistry, insulinemia, insulin resistance and Co Q10 levels.
White columns: (W group), black columns: (C group), gray columns: (L group). Treatment period: months 0–6 of study. Wash out period: months 7–12 of study. *p<0.05, ** p<0.01 vs. W within period. For HOMA-IR *p< 0.004, **p<0.008 compared with W within the period. #p<0.05 in W between periods.

