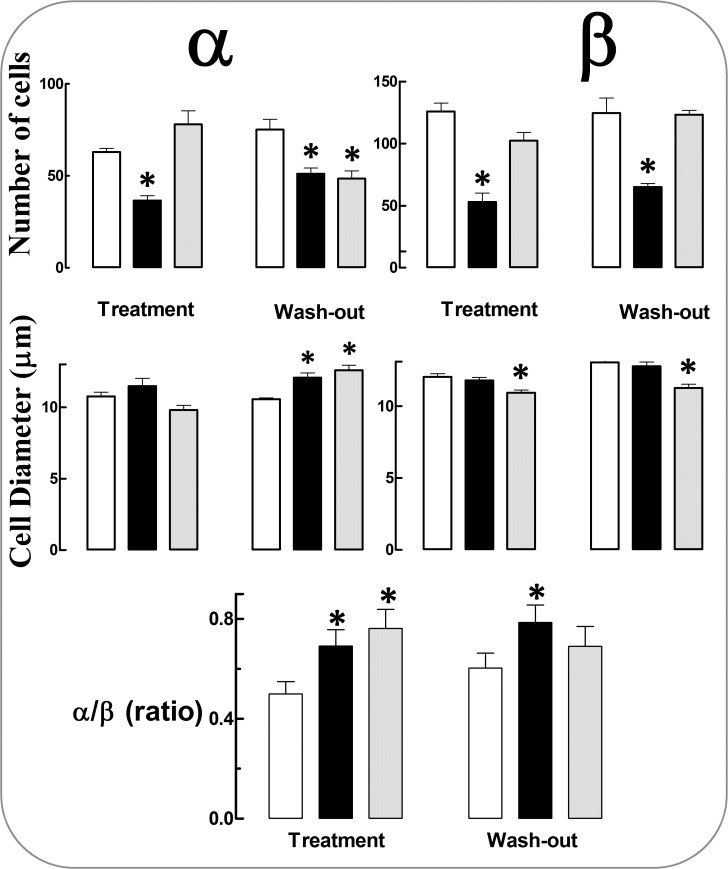
Fig 2. Alpha and beta cells in pancreatic islets: number, size and α/β-cell ratio.
White columns (water, W group), black columns (regular cola, C group), gray columns (light cola, L group). Treatment period (months 0–6 of study). Wash out period (months 7–12 of study). Mean values ± SE are shown. *p<0.05 compared with W within the period.

