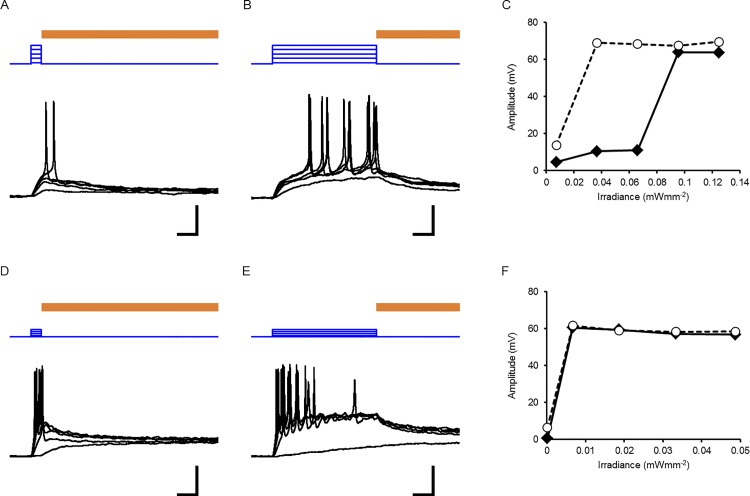
Fig 5. Photostimulation of a neuron as a function of time and irradiance.
A, A series of recordings from a typical type-1 neuron. Depolarization by blue LED irradiation for 0.1 s (blue traces) and repolarization by yellow LED light for 5 s (brown line; 0.32 mWmm−2). The threshold irradiance was 0.095 mWmm−2. B, Another series of recordings from the same neuron with blue LED irradiation for 1 s with a threshold irradiance of 0.037 mWmm−2. C, The maximal depolarization amplitude as function of irradiance; closed diamond, 0.1-s pulse and open circle, 1-s pulse). D, Responses of a typical type-2 neuron to blue LED irradiation for 0.1 s (blue traces) with a threshold irradiance of 0.0066 mWmm−2. E, Responses to blue LED irradiation for 1 s (blue traces) with the same threshold irradiance. F, The maximal depolarization amplitude as a function of irradiance. Scale bars, 0.2 s (time), 0.2 mWmm−2 (blue traces: irradiance) and 20 mV (black traces: membrane potential) for A, B, D and E.

