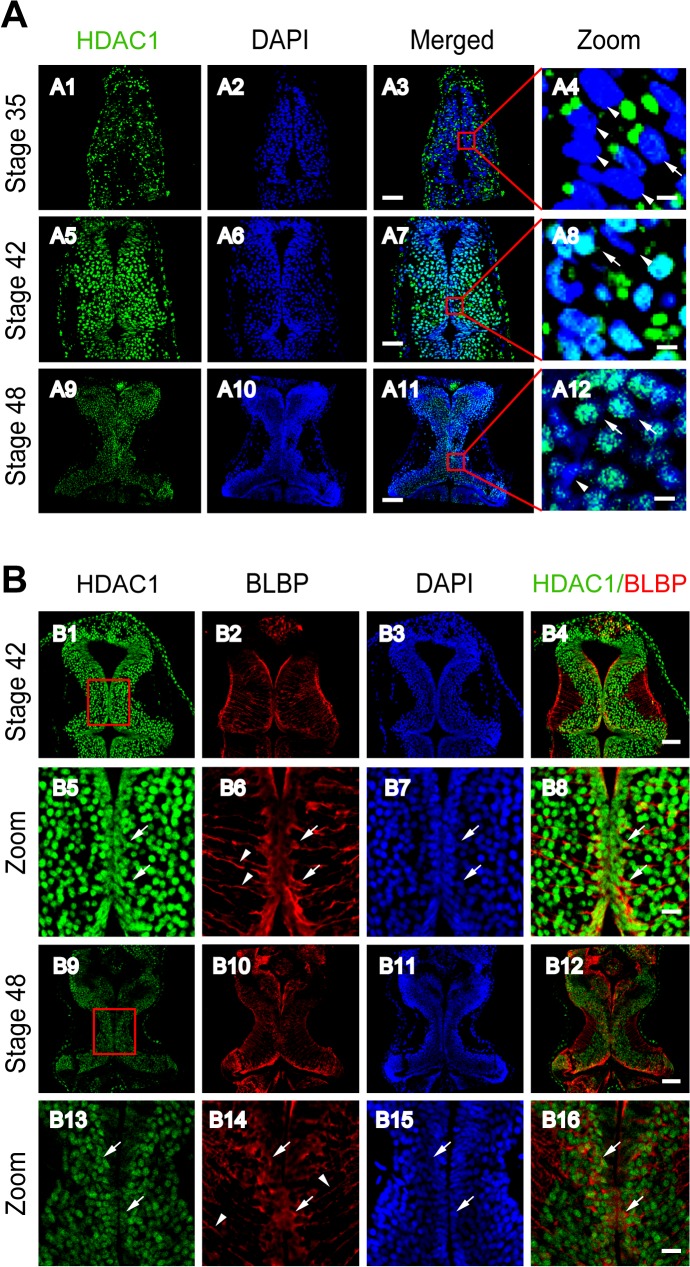
Fig 2. Developmental changes in HDAC1 and colocalization with BLBP in the Xenopus tectum.
(A). Representative immunofluorescent images showing HDAC1 staining in cells of the developing tectum at stages 35 (A1–A4), 42 (A5–A8) and 48 (A9–A12), respectively. Scale: 50 μm. Zoomed in images are demarked by red lines and are shown to the right of each original figure (A4, A8, A12). Scale: 5 μm. Arrow heads indicate cell nuclei stained for DAPI alone, whereas arrows indicate nuclei that also contain HDAC1. (B). Representative immunofluorescent images showing colocalization of HDAC1 and BLBP staining at stages 42 (B1–B4, zoom in: B5–B8), and 48 (B9–B12, zoom in: B13–B16), respectively. Arrow heads indicate the processes of BLBP-stained RGs. Arrows indicate BLBP-staining RGs contain HDAC1. Scale: 50 μm (zoom in: 10 μm).

